
The Only Assets That Owe You Nothing
Why Gold and Bitcoin belong together in the new macro regime.

The most important hypothesis we are testing right now is also one of the most consequential for portfolios: the market may be preparing for the wrong monetary shock.
Investors have spent the past several months leaning into a more hawkish interpretation of the Federal Reserve. Higher yields, a stronger dollar, tighter liquidity, and renewed fears of rate hikes have punished the assets most sensitive to that view.
We recently updated our thesis in The Hike That May Never Come, where we examined why the expected tightening could disappear before it ever arrives.
This week, we turn to two of the assets with the most to gain if that happens.
Gold and Bitcoin.
The market often presents them as rivals.
One is ancient, physical, and embedded in the world’s monetary history. The other is digital, portable, and enforced through code. Their loudest supporters argue as if investors must choose between them.
We see the opposite.
Gold and Bitcoin solve different trust problems. They draw demand from different owners. They respond to liquidity through different channels. And precisely because their drivers are not identical, they can play highly complementary roles inside a well-built portfolio.
Both have also been severely tested by the recent hawkish repricing.
Gold has suffered as real yields and the dollar moved higher. Bitcoin has absorbed the same pressure through weaker liquidity, ETF outflows, deleveraging, and fading speculative demand.
If the tightening impulse continues, both may face further pressure.
But if our Dovish Shock thesis is right, these are also two of the assets best placed to respond.
The excerpt below comes from June’s issue of Alpha Tier. It examines why the traditional 60/40 portfolio may now be incomplete, why Gold and Bitcoin belong together rather than in opposition, and what evidence would need to appear before a higher Alpha Tier Model Portfolio allocation would be supported.
The full issue goes further, showing how Gold and Bitcoin fit alongside Silver, miners, cryptoassets, and the liquidity reserve across the broader portfolio.
Here is the excerpt.
Good reading.

The traditional 60/40 portfolio has survived for a reason. Equities provided growth, while bonds supplied income and protection. For much of the past four decades, falling inflation, declining interest rates, and central-bank credibility allowed government debt to generate returns while diversifying equity risk.
That framework was highly effective in the environment for which it was designed.
But the environment has changed.
Inflation can now damage stocks and bonds simultaneously. Fiscal expansion can push yields higher even as economic growth weakens. Large public-debt burdens restrict the freedom of central banks and make financial markets increasingly dependent on accommodative conditions.
The 60/40 portfolio is not dead.
But it is incomplete.
BlackRock (BLK 0.00%↑ ) is now making a version of the same argument. That is significant for a firm whose iShares platform helped make low-cost equity and bond exposure the foundation of modern portfolio construction.
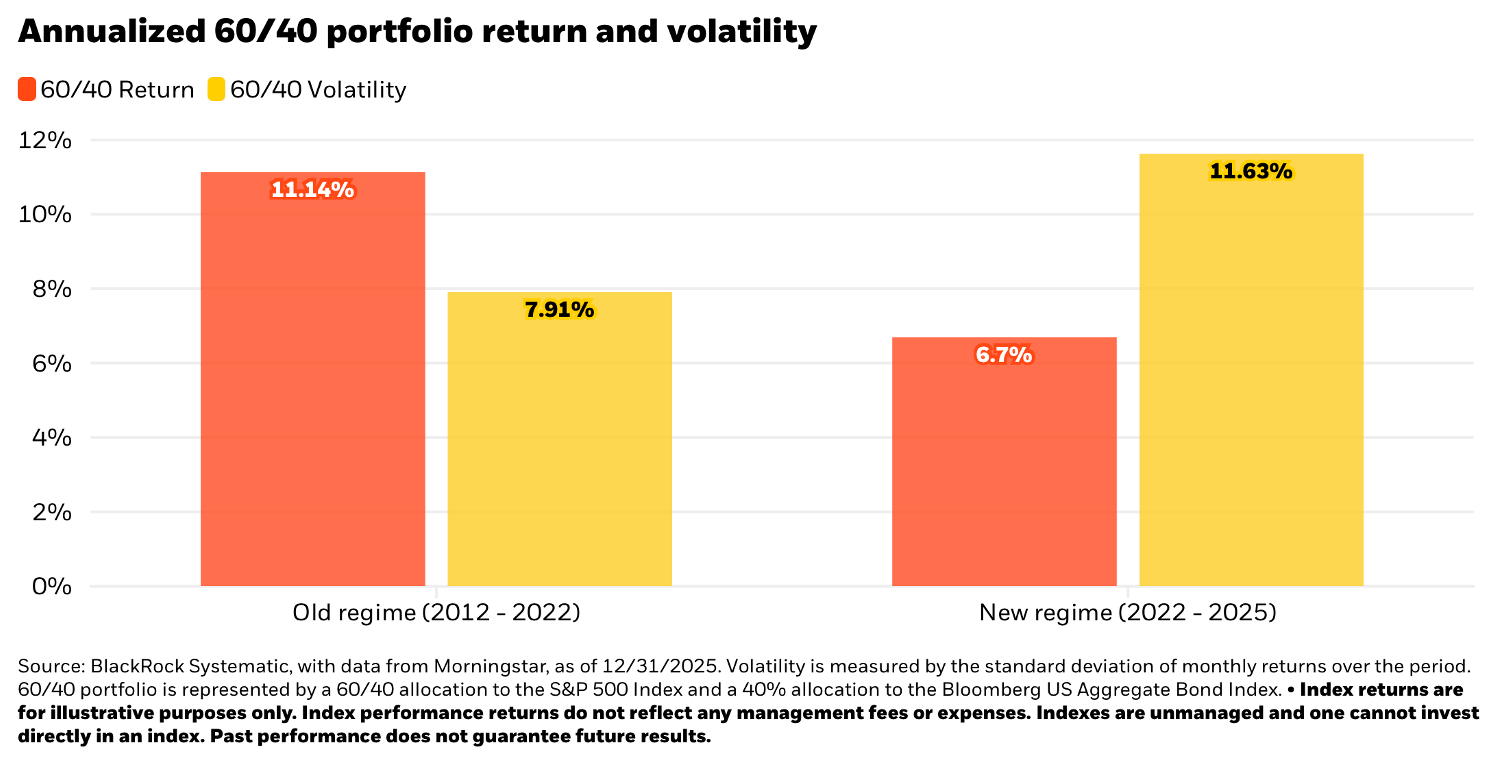
Its recent research compares the relatively benign regime between 2012 and 2022 with the period that followed. BlackRock’s illustrative 60/40 portfolio generated an annualized return of approximately 11.1% with volatility of 7.9% during the earlier period. Between 2022 and 2025, its return fell to roughly 6.7%, while volatility increased to 11.6%.
The portfolio delivered less return while exposing investors to more risk.
BlackRock attributes that deterioration to more frequent supply shocks, less predictable inflation, tighter monetary constraints, weaker diversification from bonds, and equity performance concentrated in a smaller number of companies.
We place the beginning of this regime change in 2020.
The response to the first Covid lockdown combined monetary and fiscal intervention on an extraordinary scale. Central banks created liquidity while governments transferred purchasing power directly into the economy. Those measures prevented a deeper immediate collapse, but they also changed the inflationary landscape and strengthened the connection between fiscal policy, central-bank decisions, and asset prices.
Inflation became more volatile. Bonds lost part of their defensive reliability. Governments became more dependent on favorable financing conditions, while central banks found themselves balancing price stability against increasingly fragile debt structures.
Assets linked to scarcity, liquidity, and monetary debasement consequently acquired a larger portfolio role. Our Model Portfolios were built for that environment. Both Tier One and Alpha Tier began with material allocations to Alternative Assets, particularly precious metals and crypto assets, to provide exposure to risks that a conventional stock-and-bond portfolio was poorly equipped to absorb.
The latest In Gold We Trust Report (IGWT)1 reaches a similar conclusion through a different framework. Its proposed “New 60/40 Portfolio” retains equities and bonds as the largest components but reduces their combined weight to 60%. The remaining allocation is divided among physical Gold, performance-oriented precious metals, commodities, and Bitcoin.
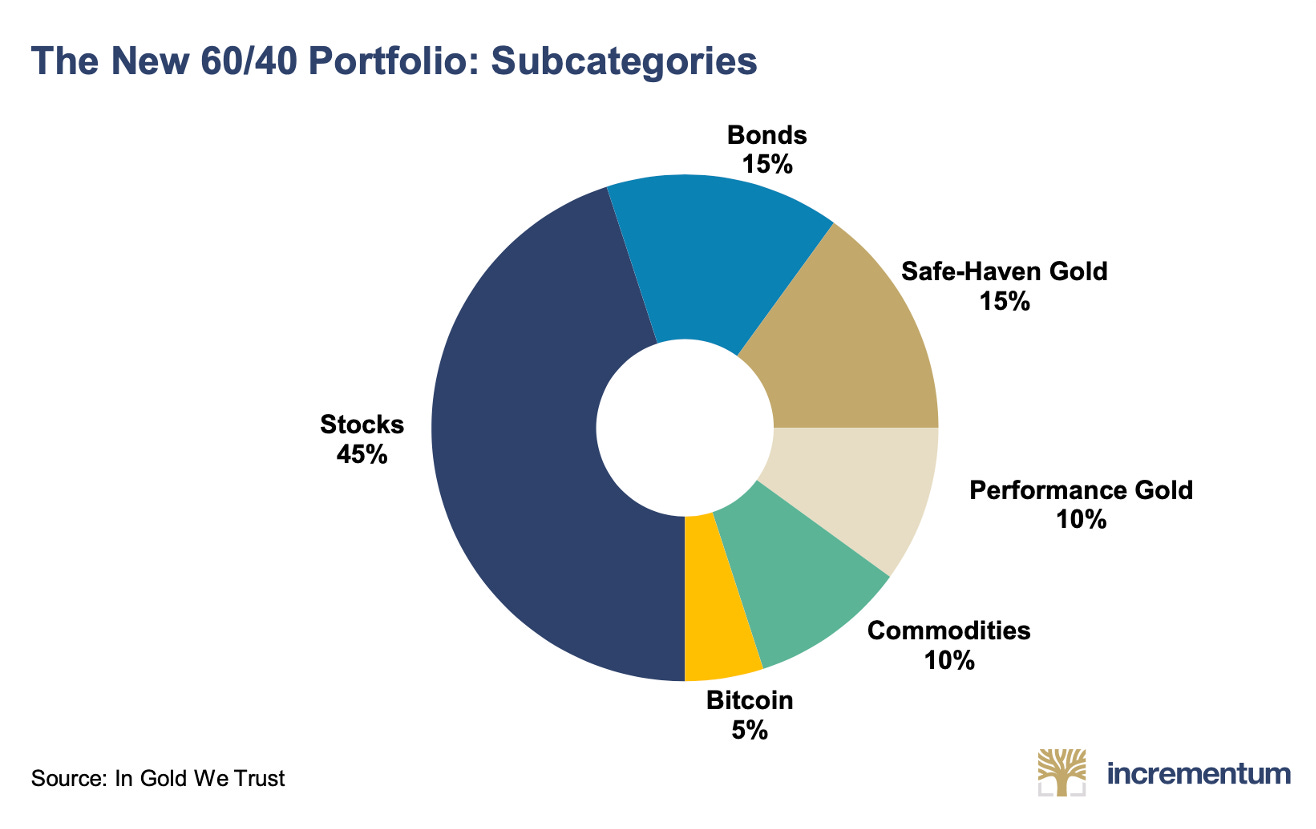
Those weights should not be copied mechanically. Portfolio construction must reflect the investor’s mandate, time horizon, valuation discipline, and tolerance for drawdowns.
The broader message is more useful: Gold and Bitcoin are increasingly being treated as structural portfolio components rather than speculative positions placed at the margins.
The historical work presented in IGWT also finds that adding Gold improved risk adjusted returns, with the strongest outcomes appearing at allocations considerably larger than the negligible weights found in many conventional portfolios. The precise optimum changes with the period and methodology, but zero was rarely the most efficient allocation.
Bitcoin extends the diversification case into a younger and more volatile monetary network. Because its ownership base, adoption curve, and market structure differ from Gold’s, the correlation between the two has remained low and unstable.
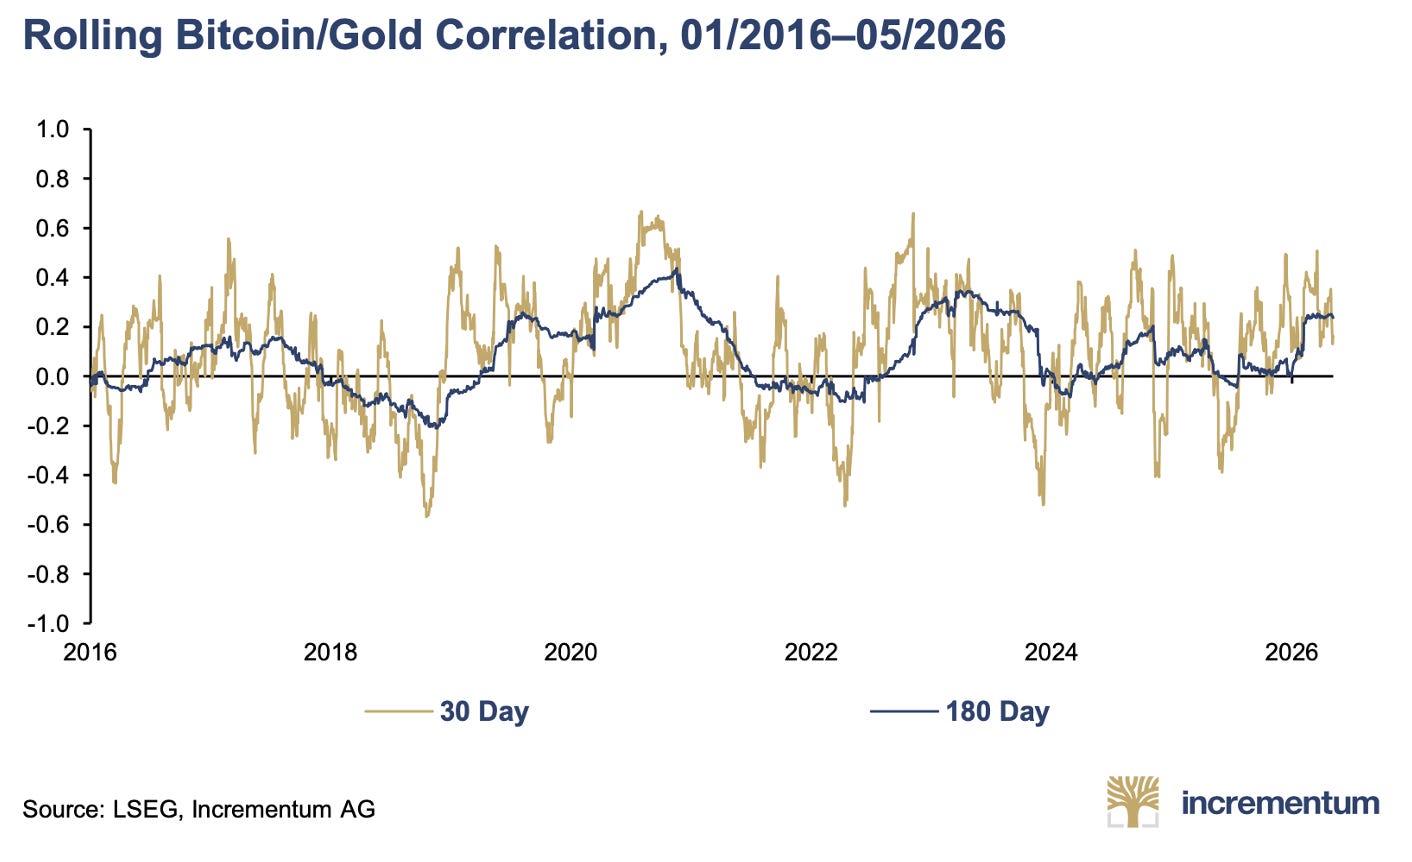
That instability is useful.
Portfolio diversification does not require assets never to rise together... it requires them not to depend entirely on the same drivers. Shared monetary forces can lift Gold and Bitcoin simultaneously, while differences in demand allow one to progress when the other is temporarily held back.
The past eighteen months illustrate the point. Gold substantially outperformed Bitcoin through much of 2025 and early 2026.
More recently, both have weakened.
The strategic question has already been answered: each deserves a place in the Model Portfolio. The immediate task is to determine whether their corrections are approaching an end and what evidence would justify allocating more capital.
Both assets were hurt by the market’s hawkish repricing. Higher nominal and real yields strengthened the dollar, tightened financial conditions, and increased the return available from conventional fixed income.
Gold entered that environment after an exceptional advance.
PHYS remains one of Alpha Tier’s strongest positions, while Silver and the Junior Miners have generated even larger gains from their original reference prices. Momentum had become extended, however, and the monetary thesis was increasingly popular.
Once rates became less supportive, the market was vulnerable to profit-taking.
Bitcoin behaved more directly as liquidity beta. ETF outflows, deleveraging, weaker sentiment across the crypto complex, and the loss of marginal demand amplified the decline.
Their technical structures tell us where confirmation must appear.
Gold retains the stronger long-term structure.
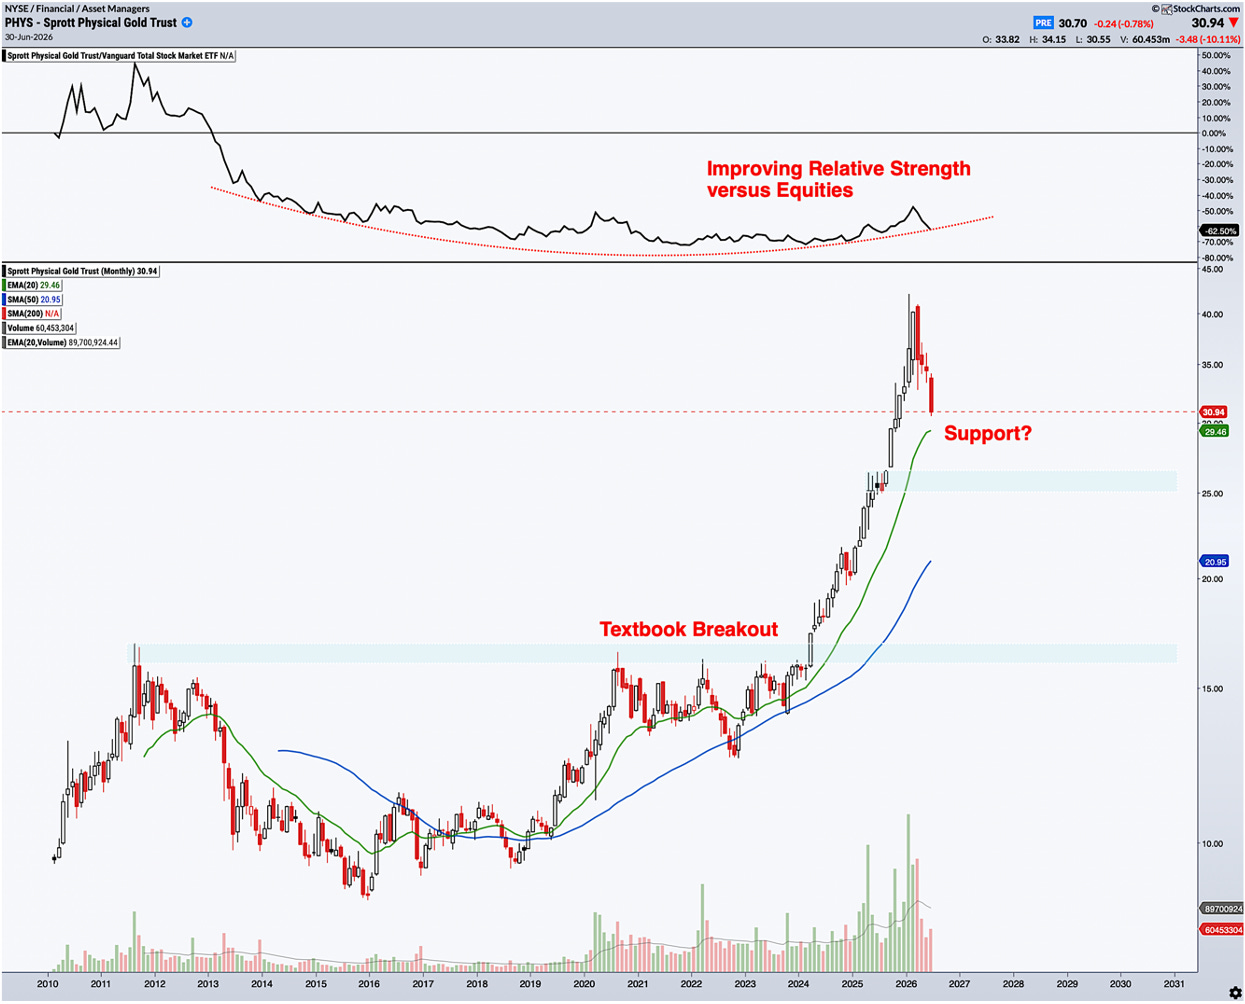
PHYS broke out from a base that developed over more than a decade, and the scale of the subsequent advance reflected the importance of that move. Its 20-month exponential moving average (green line) and 50-month simple moving average (blue line) continue to rise, while the price remains well above the original secular breakout area.
Relative strength against equities also formed a prolonged base before beginning to improve. The recent decline has interrupted that progress but has not yet reversed the longer-term relative trend.
The monthly chart therefore continues to describe a secular bull market undergoing its first meaningful test since the advance accelerated. PHYS is approaching its rising 20-month average, with broader support around the consolidation and breakout shelf formed during 2025.
Because the current monthly candle remains incomplete, an intramonth move below support would not be decisive. A recovery from this area would favor the interpretation that the decline is correcting an extended trend. A sustained monthly close beneath it would increase the probability of a deeper retest.
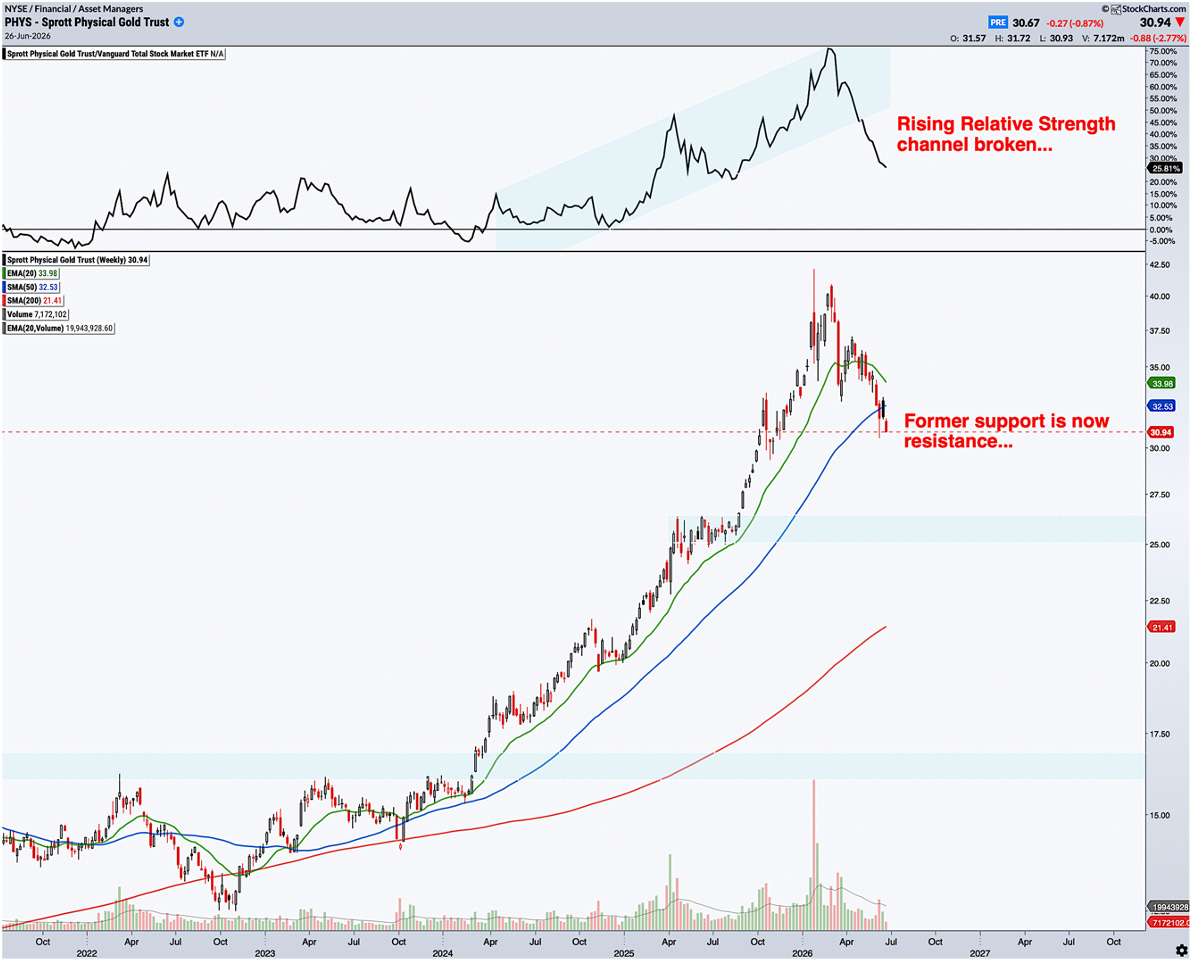
The weekly chart is less constructive. PHYS has fallen below its 20- and 50-week moving averages, while the rising relative-strength channel against equities has broken.
Gold has lost intermediate momentum and market leadership.
The area between approximately 32.5 and 34 now combines former price support with the two most relevant intermediate moving averages. Through reverse polarity, a zone that previously attracted buyers is likely to attract sellers as investors who failed to exit during the breakdown use a recovery to reduce exposure. Reclaiming that cluster would provide the first convincing evidence that the correction is repairing itself.
The conclusion is straightforward: the secular trend remains bullish, but the intermediate trend has not yet turned.
Bitcoin faces a more demanding repair.
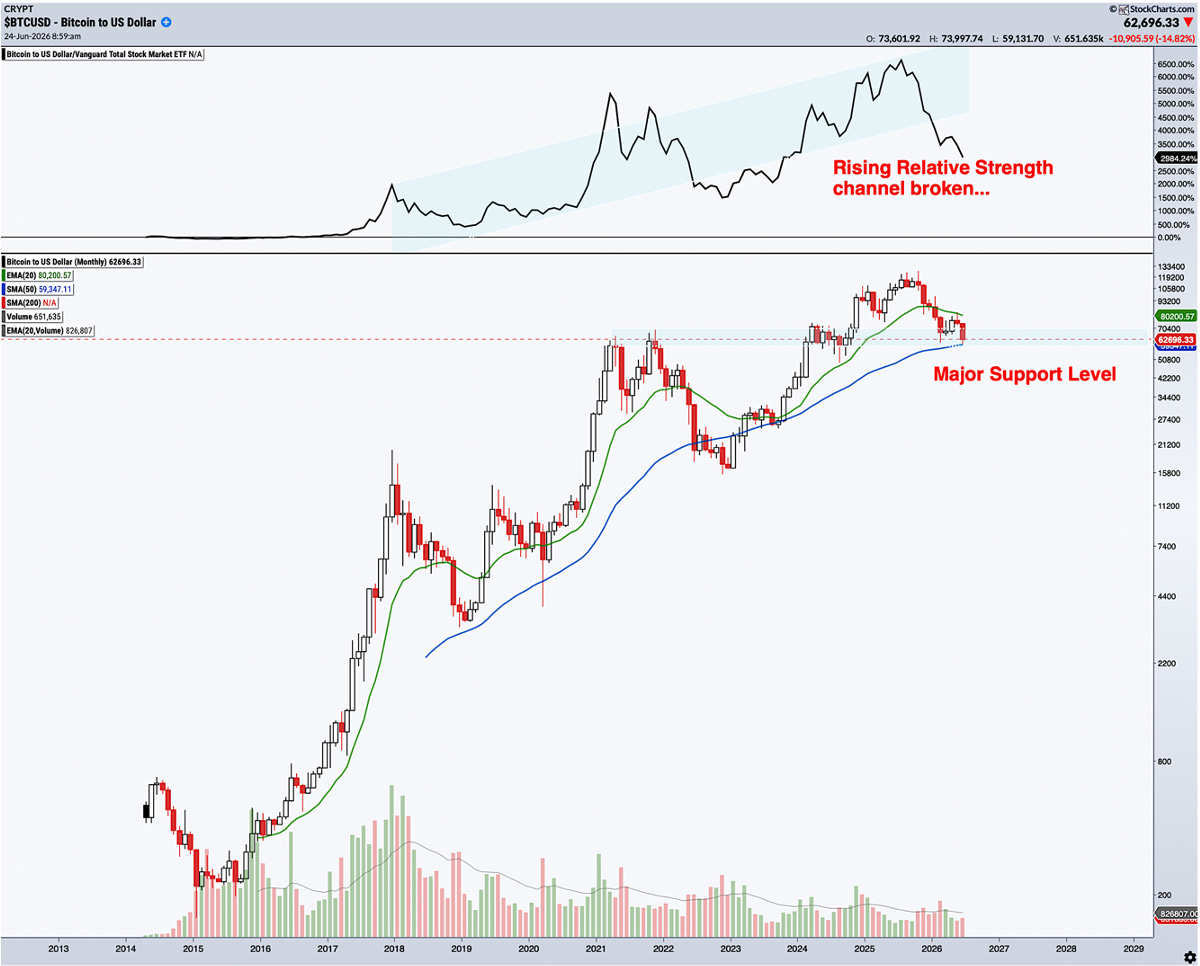
The monthly chart shows Bitcoin returning to major support after losing the momentum that carried it to new highs. Price has fallen below its 20-month exponential moving average (green line) and is testing a zone containing the rising 50-month simple moving average (blue line) and the breakout area from the previous cycle.
Relative strength against equities has also broken beneath the channel that supported much of the advance, confirming that Bitcoin has lost leadership as well as price momentum.
A successful monthly defense of this area would preserve the interpretation of a severe correction within a continuing secular advance. A decisive close beneath the 50-month average and surrounding support would expose the asset to a deeper adjustment.
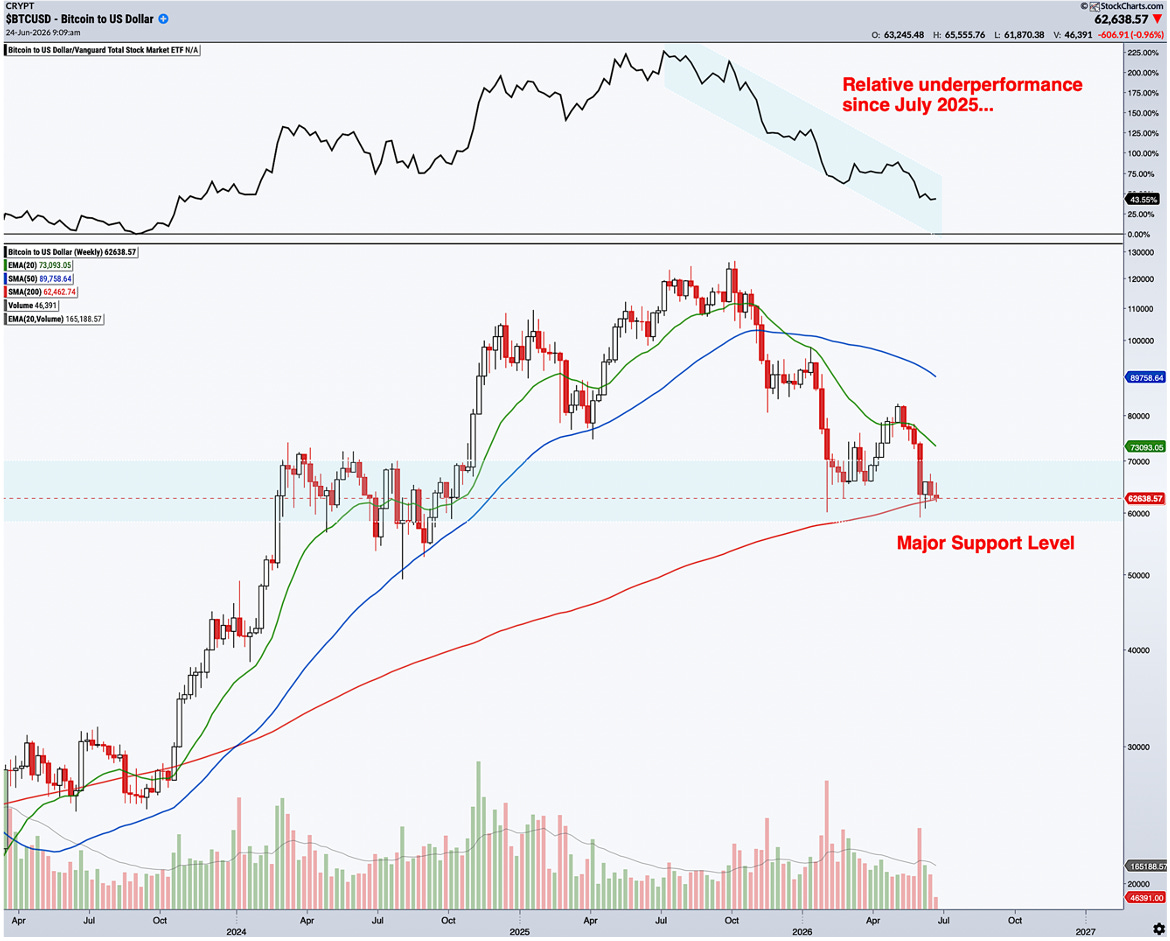
The weekly chart reinforces the importance of the current zone.
Bitcoin has underperformed equities since July 2025 and remains beneath declining 20- and 50-week moving averages, both of which now represent overhead resistance.
At the same time, price is testing its rising 200-week moving average (red line) near the lower boundary of support. That average has mattered across several Bitcoin cycles, although the brief break beneath it in 2022 reminds us that no technical level is inviolable. Its present significance comes from confluence with the monthly support zone and a region of substantial prior trading activity.
Holding this area would preserve the long-term thesis. A sustained weekly break would materially weaken it.
The first evidence of repair would be a recovery above the 20-week exponential moving average (green line) in the low-$70,000 region. Reclaiming the higher 50- week average (blue line) would provide stronger confirmation that the intermediate downtrend had ended.
Gold’s secular structure therefore remains clearly bullish despite the deterioration in its weekly trend. Bitcoin has suffered greater damage across both timeframes, but it is testing identifiable long-term support rather than trading in technically uncharted territory.
How those tests are resolved will depend heavily on the same macro forces that caused the damage.
Rising yields strengthened dollar-denominated assets, lifted real rates, and drained liquidity from markets most dependent on easier financial conditions. Gold absorbed that pressure through a higher opportunity cost and weaker Western flows. Bitcoin absorbed it through falling marginal demand, ETF redemptions, and deleveraging across the crypto complex.
The dollar and the long end of the Treasury market will now tell us whether that tightening impulse is approaching an end.
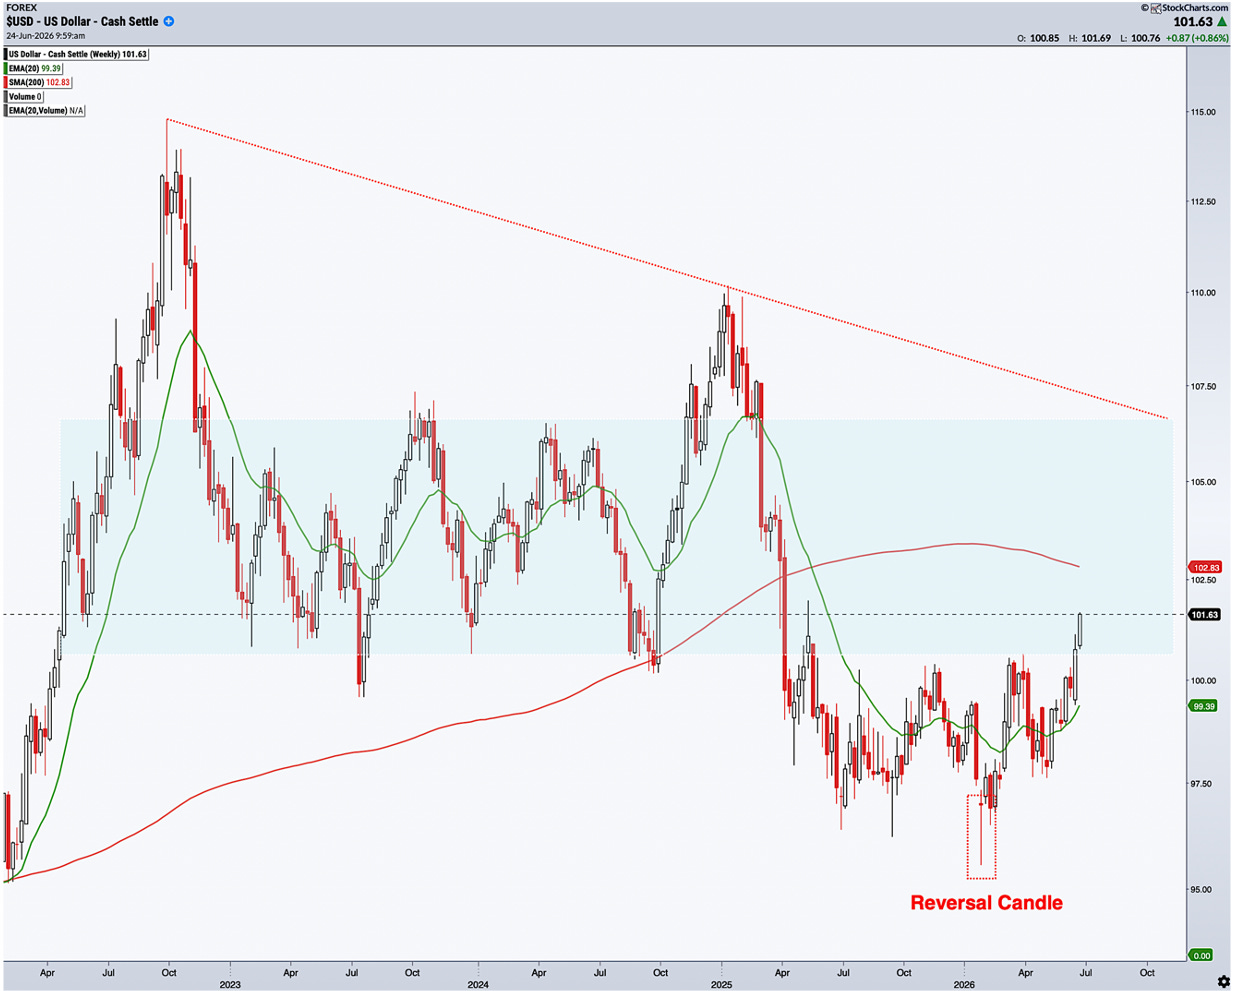
The dollar formed a significant reversal candle near its early-2026 low and has recovered toward broad resistance. Its 20-week moving average (green line) has turned higher, while the 200-week average (red line) near 103 lies directly ahead. The upper portion of the range that has contained the index since 2022 and the descending trendline from that cycle’s peak provide additional resistance above it.
A confirmed breakout has not yet occurred, but further appreciation would extend the tightening already visible across global markets.
Dollar strength attracts capital toward the United States, increases the burden of dollar-denominated debt, and restricts liquidity elsewhere.
Persistent appreciation also raises the local-currency cost of Gold for international buyers and increases the relative appeal of US fixed income. Bitcoin is even more sensitive because its strongest advances have generally coincided with easier dollar liquidity and a greater willingness to accept risk.
The present resistance zone therefore provides a useful decision point. A move through the 200-week average and the upper boundary of the range would prolong the tightening impulse. A rejection would remove an important obstacle, especially if long-term yields weakened at the same time.
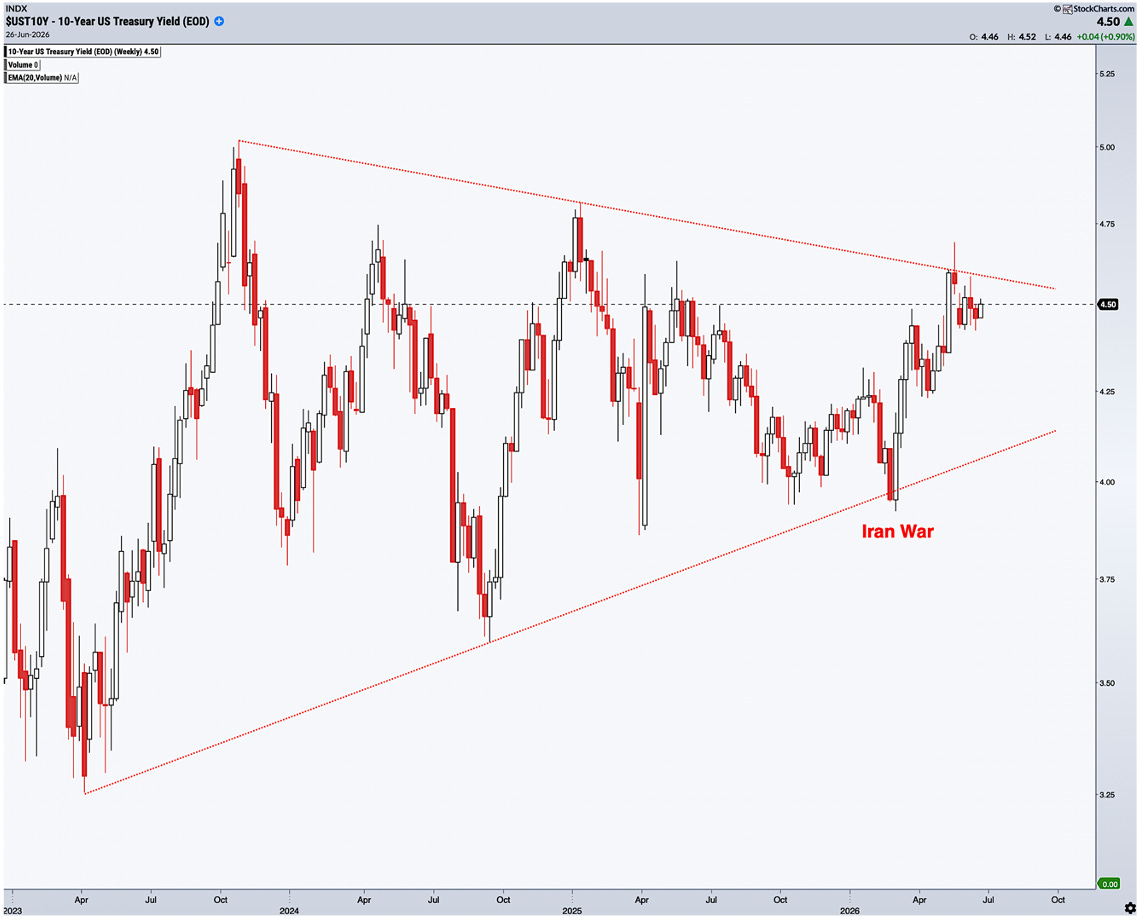
The ten-year yield is compressing between descending resistance from its 2023 peak and a rising support line connecting the major lows that followed. At approximately 4.5%, it is again testing the upper boundary of that structure.
An upside resolution would tighten financial conditions even without another increase in the Fed Funds rate. Mortgage costs, corporate financing rates, and equity discount rates would remain elevated, while the government’s refinancing burden would continue to rise.
If nominal yields increased faster than inflation expectations, real yields would remain restrictive... the combination that has weighed most directly on Gold. For Bitcoin, higher long-term yields increase the return available from safer assets, raise the cost of leverage, and reduce the capital willing to pursue distant or uncertain payoffs.
A rejection from resistance would suggest that the hawkish repricing was losing momentum and that one of the principal sources of pressure on both markets was approaching an inflection point.
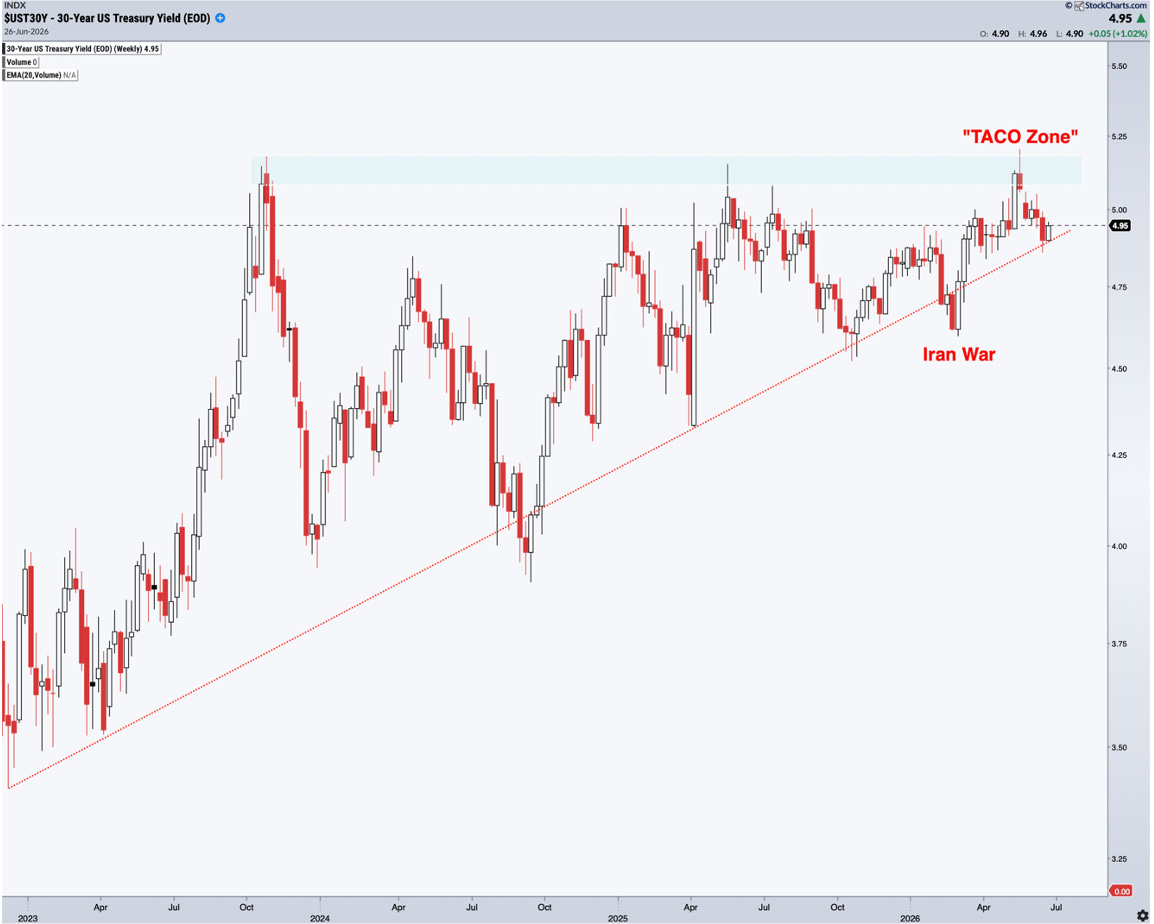
The thirty-year yield raises the stakes because it is where a market problem can become a policy problem. It is once again approaching the 5.1%–5.2% region that we have labelled the “TACO Zone.”
The name is deliberately provocative. The level itself is best understood as a policy-pressure zone rather than a guaranteed ceiling.
A sustained breakout would feed directly into mortgage rates, long-duration corporate financing, infrastructure investment, equity valuations, and federal interest expense. It would also signal that investors were demanding greater compensation for inflation, duration, or fiscal risk.
At those levels, the incentives of the Trump Administration, the Treasury, and the Federal Reserve increasingly converge.
The Trump Administration has a political interest in preventing financing costs from damaging housing, investment, and asset prices. The Treasury must preserve orderly market functioning and refinance a large debt stock. The Fed cannot ignore a severe tightening in long-term financial conditions merely because the overnight policy rate has not changed.
Possible responses include less inflationary fiscal or trade policy, adjustments to the maturity composition of Treasury issuance, more active use of buybacks, lower policy rates, or liquidity support if market functioning deteriorates.
The exact instrument matters less than the pressure behind it. The economic and political cost of maintaining a hawkish stance rises sharply when long-term yields threaten growth, financial stability, and debt sustainability simultaneously.
This concern is no longer confined to traditional fiscal bears. Some of the most influential figures in finance have begun warning about the same relationship between debt issuance, interest expense, and the stability of the Treasury market.
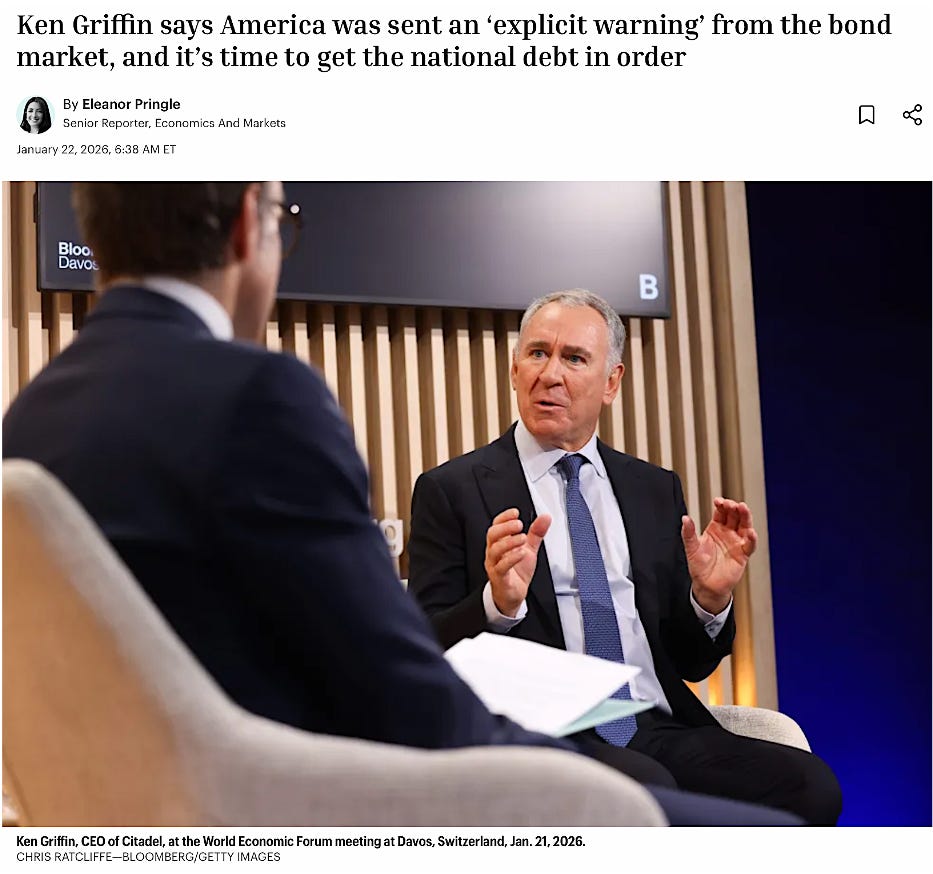
The feedback loop lies at the heart of Fiscal Dominance. Higher yields increase government interest expense. Greater interest expense expands future financing requirements. Additional issuance can then push yields higher still, eventually forcing a choice between monetary restraint and system stability.
The Fourth Turning framework gives that choice historical context. Governments rarely remain passive while institutional stress compounds. Political involvement expands, the boundary between fiscal and monetary policy becomes less distinct, and system preservation gradually takes precedence over earlier conventions.
Beat the old playbook. Get institutional-grade research delivered to your inbox.
Yet one element of the hawkish narrative is already beginning to soften...
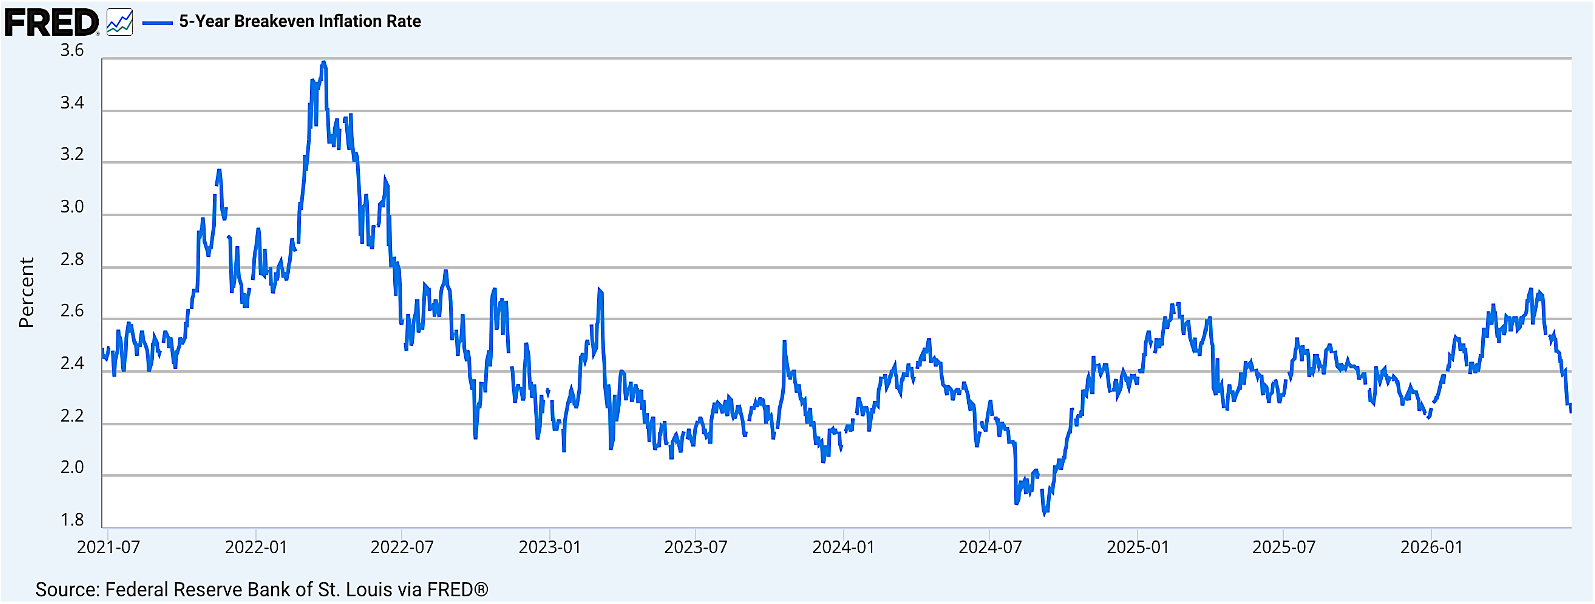
Market-based inflation compensation has moved lower across several horizons. The five-year breakeven captures average inflation compensation over the next five years and is the most sensitive to current energy prices, tariffs, and cyclical conditions. The ten-year measure covers the coming decade, while the five-year, five-year forward rate isolates the five-year period beginning five years from now and therefore provides a cleaner signal of longer-term inflation credibility. The recent decline across all three suggests that investors are becoming less concerned about persistent inflation, even as nominal Treasury yields remain elevated.
Breakevens are not pure inflation forecasts. They also contain inflation-risk and liquidity premia. Their direction nevertheless creates a tension within the prevailing market narrative: investors continue to price restrictive interest-rate conditions while the compensation demanded for future inflation is beginning to recede.
That tension strengthens the asymmetry behind our Dovish Shock thesis.
You might also like reading:

The catalyst could be softer inflation, weaker employment, lower oil prices, deteriorating credit conditions, or policy action intended to prevent long-term yields from breaking decisively higher. Markets may identify the catalyst only after prices begin to respond, but the transmission would be familiar: lower expectations for further tightening, falling real yields, weaker support for the dollar, and improved global-liquidity conditions.
Those changes would address the forces behind the recent weakness in Gold and Bitcoin.
Gold should respond most directly to lower real yields and a softer dollar. Silver and the miners would offer greater torque if the move broadened across the precious metals complex.
Bitcoin would benefit from better liquidity conditions, although a durable recovery
should also be confirmed through stronger ETF flows, improving relative strength, and broader participation across Ethereum, Solana, and the rest of the crypto market. Having already endured substantial deleveraging and sentiment damage, the sector could respond powerfully once those conditions align.
A Dovish Shock would not create the secular case for either monetary universe. That case rests on sovereign-debt accumulation, Fiscal Dominance, monetary debasement, reserve diversification, digital adoption, and the recurring need for liquidity in an increasingly leveraged financial system.
But it could remove the obstacles currently preventing those forces from reasserting themselves in price.
As the evidence we presented suggests, those conditions remain prospective rather than confirmed.
The Alpha Tier Model Portfolio already carries substantial exposure to Gold, Silver, Junior Miners, Bitcoin, Ethereum, and Solana. There is no need to increase risk merely to demonstrate conviction. The 5% allocation to short-duration Treasuries preserves optionality and pays us while we wait.
Gold must defend its long-term structure and reclaim the former-support and moving-average cluster on the weekly chart. Bitcoin must hold the convergence around its 200-week and 50-month moving averages, then recover its 20-week trend with improving relative strength.
At the macro level, a rejection in the dollar and long-term Treasury yields would strengthen the case that the Dovish Shock was beginning to appear in market prices.
Simultaneous breakouts in both would argue for continued restraint.
Until then, patience is the position.
That discipline completes the first side of The Architecture of Trust. Gold and Bitcoin are distinctive because neither depends on a sovereign or corporate issuer honoring a promise. Their scarcity exists independently of a government balance sheet, a management team’s judgment, or a board’s willingness to treat shareholders fairly. That characteristic becomes more valuable when confidence in institutions, currencies, and fiscal discipline begins to weaken.
The operating businesses through which we express parts of these themes are different. Miners, exchanges, custodians, and other listed companies return capital to the hands of executives, boards, founders, and controlling shareholders.
Scarcity is no longer enough.
Ownership, incentives, governance, and capital allocation become decisive.
The next question is therefore not what we trust.
It is whom.
A quick note on accountability.
We don’t publish these theses to be right on paper. We publish them to express edge in the real economy. Our Leaderboard shows the exact scorecard since inception, tracking every position, our compounding outperformance against the market, and the triple-digit winners we’ve captured along the way.
Important Disclosure
This article contains general investment research produced by Vasco Marques de Freitas, CFA, CMT, Founder and CEO of VMF Research, Lda. It is not personalised investment advice and does not consider any reader’s individual objectives, financial circumstances or tolerance for risk. The analysis and Alpha Tier Model Portfolio information are stated as of 26 June 2026, 4:00 p.m. Eastern Time. The Model Portfolio is an illustrative research portfolio and does not represent client assets or transactions executed by VMF Research. Gold, Bitcoin and related financial instruments are volatile and may generate substantial losses. The views expressed may change as market conditions and evidence evolve and are reviewed through VMF Research’s monthly, weekly or ad hoc publications.
Disclosure of interests: legal entities controlled by the author hold long positions in Coinbase Global, Inc. and in a listed Bitcoin ETP. These interests may create potential conflicts and should be considered when evaluating the analysis.
Past performance is not indicative of future results. Readers should conduct their own analysis and, where appropriate, consult an authorised financial adviser.
First published in 2007, the In Gold We Trust Report is the annual monetary and macro study authored by Ronald-Peter Stöferle and Mark J. Valek. Its twentieth edition extends beyond Gold into inflation, sovereign debt, commodities, Bitcoin, and geopolitics. We referenced it most recently in June’s VMF’s Security Selection.