
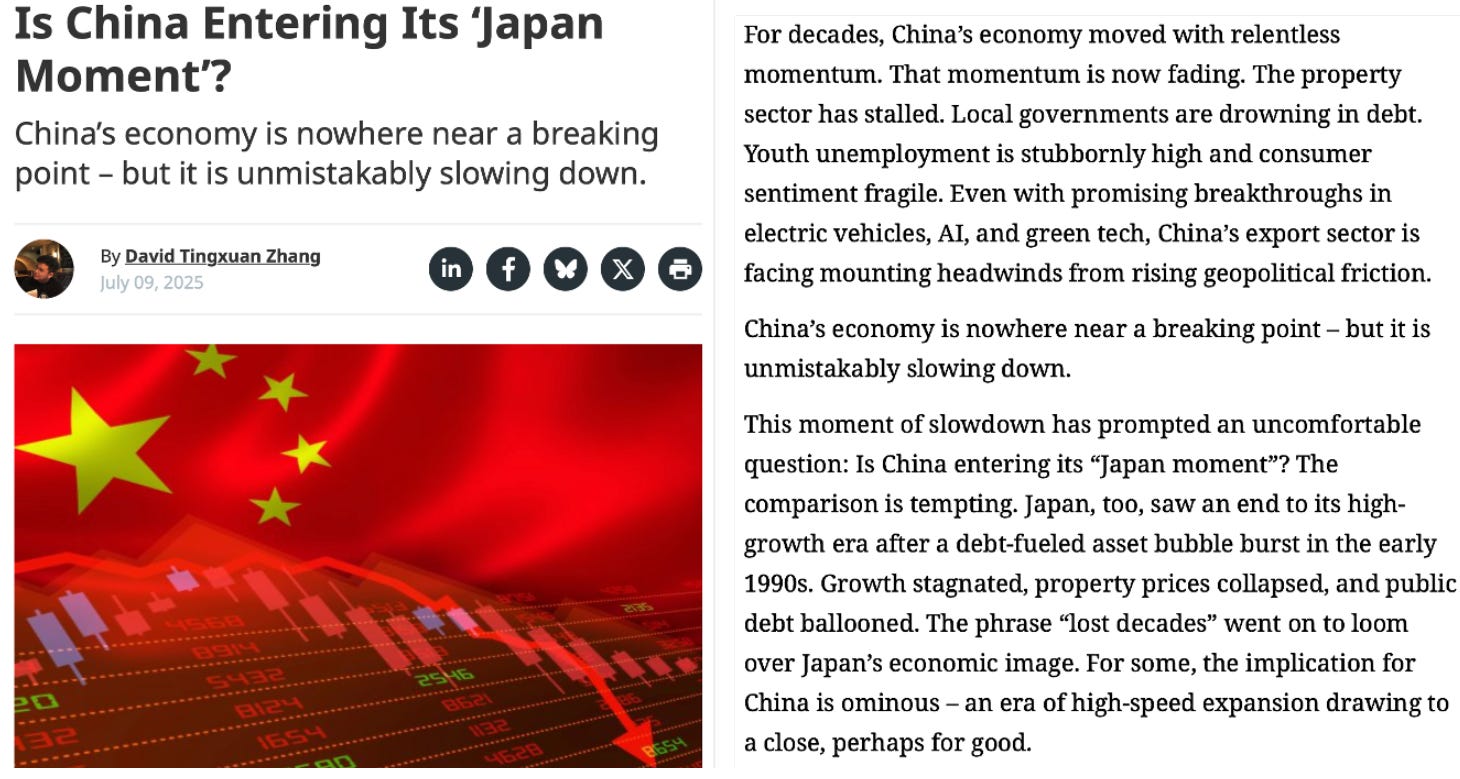
Turning Japanese - Part Two: The Final Boss and the Debasement Trade
Why China isn't 1989 Japan, and the Alarms Ringing in Tokyo Signal the End of the Global Cycle

Welcome back.
In Part One, we laid out Japan’s 40-year monetary playbook, the ultimate cheat sheet for what happens when central banks choose intervention over a real crisis. That history matters now, because it tells us exactly how Washington will respond when the next inevitable crash hits.
But first, let’s turn the lens on China, a major overweight in our Model Portfolio: are we riding a genuine rebound, or is this the world’s next ‘Lost Decade’ in the making? Here’s the data that separates the two stories.

We don’t need to spend a lot of “page real estate” dissecting why this Japan roadmap is so important right now. It’s obvious. And it’s important for several reasons.
First, if you’ve been reading our work for a while, you’ve probably already noticed this Japanese pattern replaying elsewhere. The late-1980s equity and real-estate mania in Tokyo, the dot-com bubble that crested in 2000, and the U.S. real-estate bubble that crested in 2007, and, crucially, the reactions that followed.
Each time, political and monetary authorities stepped in with bigger and more creative interventions. Each time, the system was “saved” with more debt and more manipulation of interest rates and liquidity.
The difference is simple: Japan did it first, and Japan did it bigger.
That’s why we’ve taken the time to walk you through this 40-year roadmap. The point isn’t to stare at the past for its own sake. It’s to recognize the pattern: the rise, the bubble, the crash, the intervention regime, so we can see what’s happening in front of us now, and better yet, to better anticipate what could come next!
But we’ll save what we see coming next for a few pages ahead.
Before we project Japan’s roadmap onto what it means for global markets, we need to reconcile it with a more concrete focal point: China. After all, China is a major overweight in our Model Portfolio. So, it matters, a lot.
Could China Be the Next Japan?
This isn’t just a question pundits ask to sound smart on TV. It’s one of the central macro questions of our time. In the 1980s, Japan was the big rival to American dominance. The rising industrial power, the export machine, the country that “could only go up” until it couldn’t. Today, that role belongs to China. For two decades it has been the engine of global growth, the marginal buyer of nearly every commodity on Earth, and the reason emerging markets even exist as an asset class.
And yet, the parallels with late-1980s Japan are hard to ignore.
China’s real-estate boom in the 2000s and 2010s led to sky-high property prices and massive overbuilding. Whole cities were thrown up almost from nothing. By the early 2020s, that boom began to crack. Evergrande (a household name by now) defaulted under a staggering debt load, and a long list of highly leveraged developers followed it into distress. The weakening housing market now threatens China’s broader economy in a way that feels eerily similar to Japan’s property collapse in the early 1990s (detailed in Part One).
Like Japan back then, China’s growth has been heavily debt-fueled (in this case, a mix of corporate, local-government, and real-estate leverage). Both economies relied on an export-driven model with relatively low domestic consumption. Both have rapidly aging populations that put a drag on future growth potential. China’s working-age population has already peaked and is now shrinking, just as Japan’s did when its bubble burst.
In other words, at the macro level, the setup looks uncomfortably familiar:
high debt,
an aging society,
an overbuilt property sector,
and a growth model that depends too much on exports and investment, not enough on the consumer.
No wonder people ask, “Is China about to go the way of Japan?”
There are differences, of course. China is still a lower-income country than Japan was at its peak, which gives it more room for catch-up growth if it reforms. It’s far more assertive geopolitically, and far less beholden to Washington. Beijing can impose capital controls, force banks to recognize losses, or prop up the housing market with an intensity Tokyo never quite matched. Those differences matter.
But this is where having a disciplined, structured Investment Process matters even more. It’s one thing to say, “The macro looks similar, therefore the outcome must be the same...”
It’s another to actually walk through the other four pillars we use at VMF Research (Fundamentals, Sentiment, Technicals, and Liquidity) and ask what’s different this time.
And in China’s case, a lot is different.
Regarding Fundamentals, Japanese equities in the late 1980s were priced for perfection and then some. The Nikkei traded at valuations that simply assumed a straight-line future of never-ending growth. China today is the opposite. Chinese equities still trade at deeply depressed valuations, with many high-quality franchises priced as if permanent stagnation were guaranteed. That’s one of the main reasons we launched our Model Portfolio in May 2024 with a big China overweight right from the start. And although prices have already come a long way since then, the fundamental thesis remains intact.
“Turning Japanese” was part of our November Alpha Tier. If you want to access the full content inc. the actual playbook: tickers, weights, and our month-by-month moves get the full issue now.
Join Alpha Tier @ VMF Research.
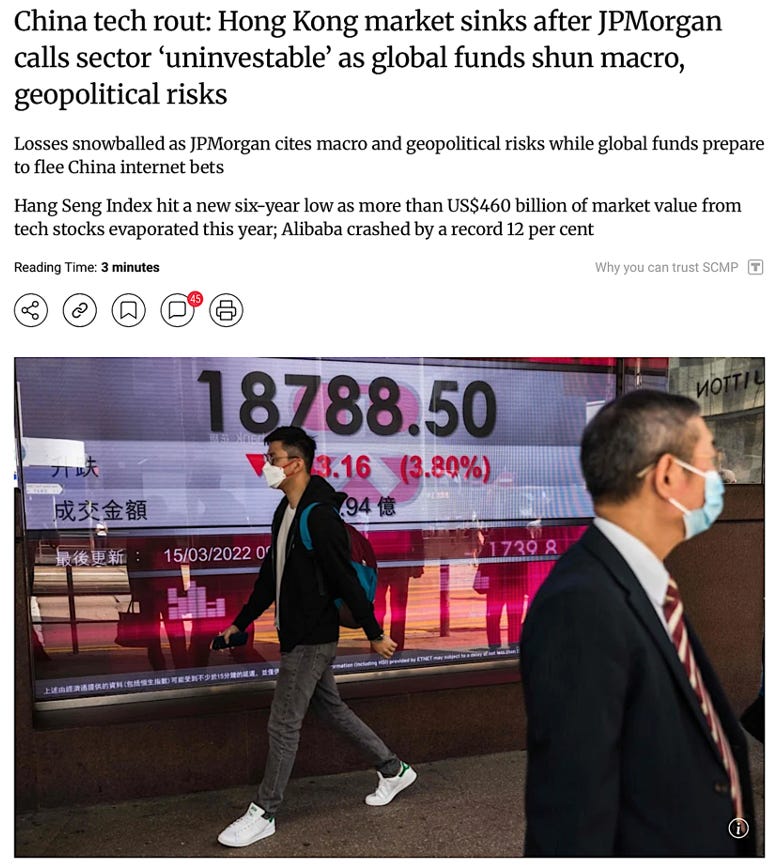
On the Sentiment side, the mood couldn’t be more different either. Japan in 1989 was pure euphoria. People believed in Japanese exceptionalism. Books proclaimed Japan would own the future. What we saw when we began building our China positions was the mirror image of that: sheer pessimism. In the West, Chinese equities were widely considered “uninvestable.” Headlines were uniformly negative, and anything with “China” in its name was treated as untouchable. That’s not what bubbles look like.
That’s what capitulation looks like.
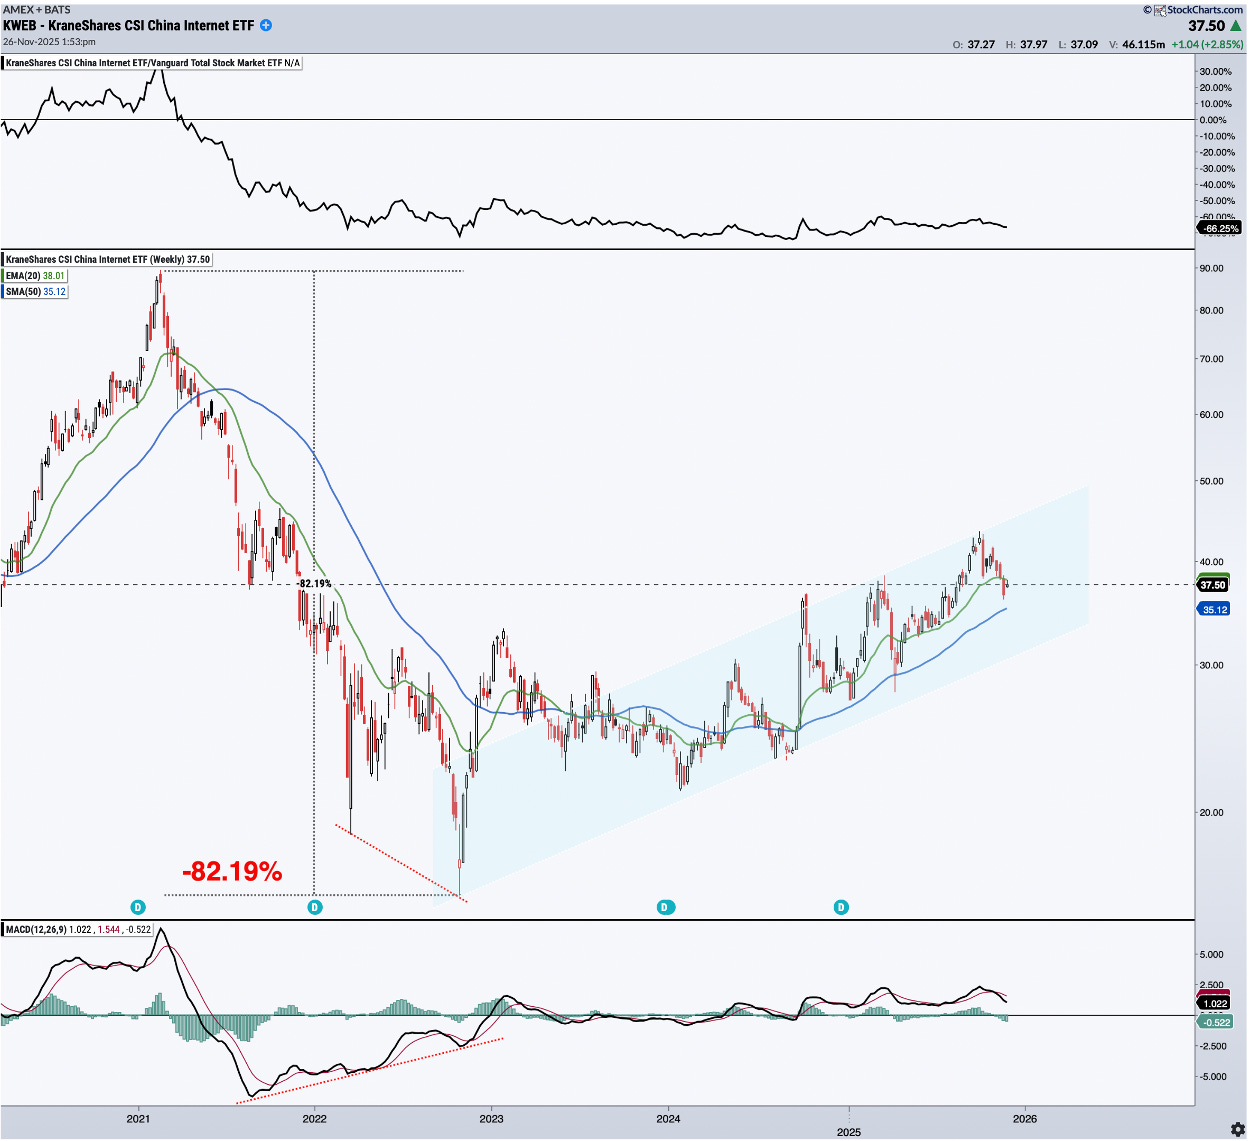
In the Technicals domain, our last chart tells the same story. Japanese equities in the late 1980s went vertical in a classic parabolic ascent: sharp, accelerating, unstable.
China, when we first invested and still today, is showing something very different: clear, robust bottoming patterns, a healthy (and not too steep) upward channel, and the first signs of accumulation by Western institutional investors. Frankly, it’s one of the best technical backdrops we have in the entire Model Portfolio.
And when it comes to Liquidity, well, here the similarities really start to pile up.
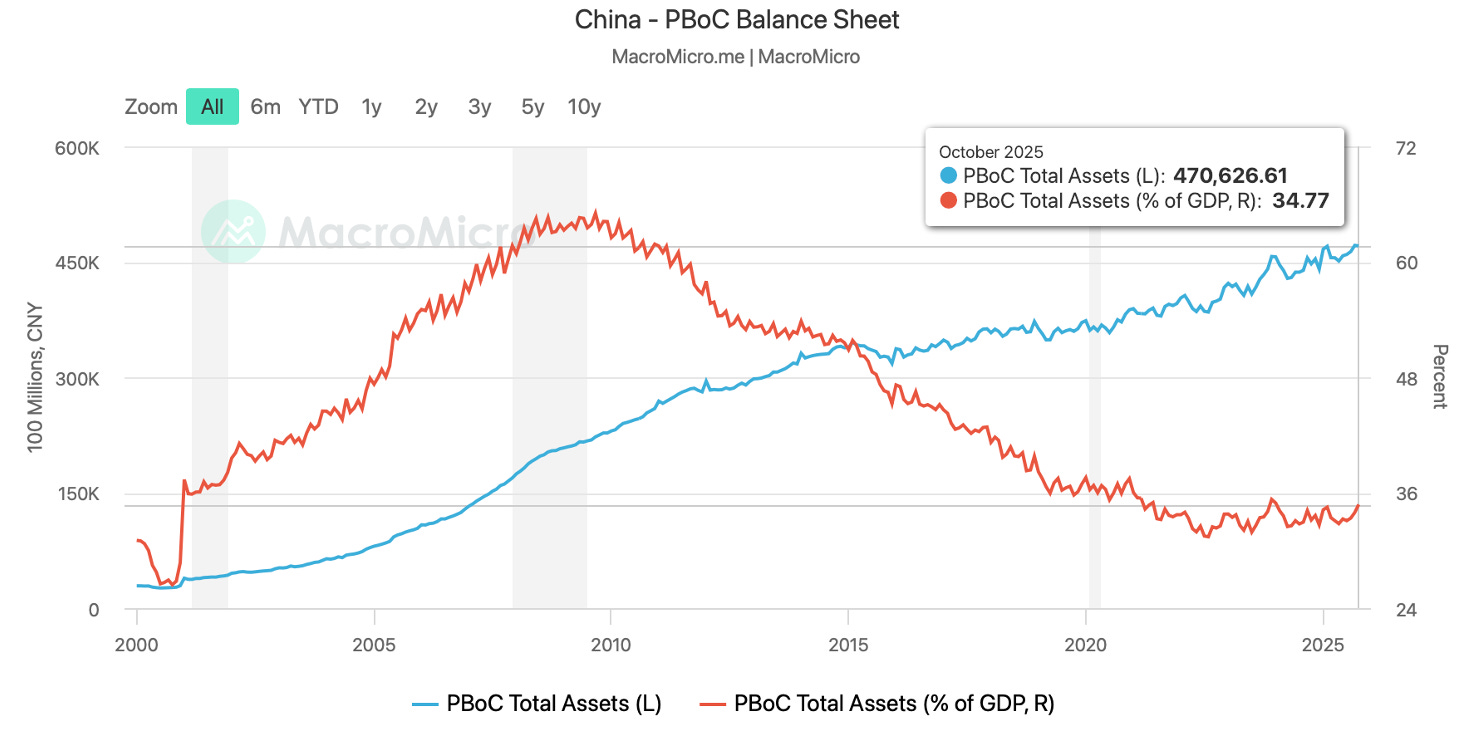
China’s central bank, the PBoC, is responding to the post-Covid slowdown and ongoing economic malaise with increasing vigor. Cuts in policy rates, targeted easing for the property sector, credit support for strategic industries... these aren’t hypotheticals. They’re already happening, and we fully expect more. In other words, the liquidity backdrop we’ve been pounding the table on — the catalyst for the Great Debasement Trade — is alive and well in China.
However, there’s an important twist versus Japan.
What’s different is the size of the PBoC’s balance sheet relative to the size of its economy. As we’ve already seen, not only is China’s central bank balance sheet still rising in absolute terms (one of the very few among the world’s five biggest central banks that is) but it’s also rising in relative terms versus GDP.
And crucially, it’s doing so from a much lower base, with, in our view, plenty of room to expand further.
That’s the crucial distinction on the Liquidity front.
So yes, the macro “Japan versus China” comparison matters. Yes, the structural risks are real. But we’re not buying a carbon copy of Japan 1989 at 60–80x earnings with everyone drunk on optimism. We’re exposed to a still-unloved market, at depressed valuations, with sentiment washed out, technicals turning up, and a liquidity machine behind it that is just getting started.
And that is exactly the kind of setup our Investment Process is designed to identify.
Now that we’ve used Japan’s roadmap to stress-test one of our most important investment theses, it’s time to turn the lens around and ask a harder question.
What does this roadmap suggest comes next for Western Central Banks?
You already know what we’re expecting as we close out 2025, after all, we’ve been torturing you with it almost to the point of exhaustion here and in VMF’s Strategic Asset Allocation.
But here it goes again: We expect more liquidity. And we’ve been specific enough to map out how that liquidity arrives: with QT winding down, with the Treasury General Account being drained, with rate cuts back on the menu (and even with some more exotic measures like changes to the SLR).1
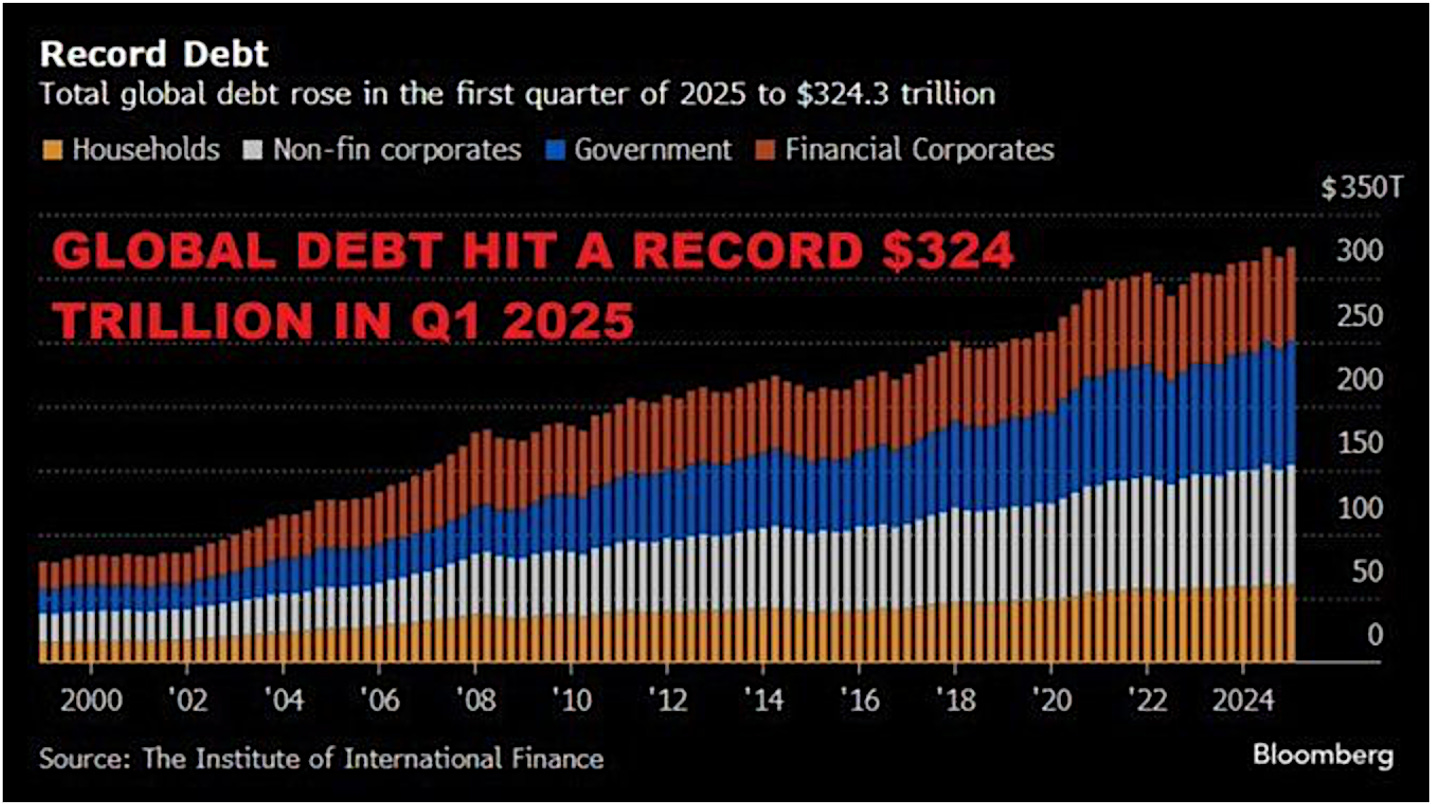
More important than how the liquidity arrives is why it’s needed, and yes, we’ve been torturing you with this too: to keep the great debt-rollover machine running.
Just as in Japan, debt in the West (particularly in the U.S.) keeps climbing. It has to be financed. And, much like in Japan, it’s increasingly central banks, not truly free private markets, that make that financing and those rollovers possible.
But here’s the uncomfortable question…
What if the liquidity measures we’ve been highlighting aren’t enough?
What if QT ending, a drained TGA, and a couple of rate cuts don’t stop the next real risk-off wave? What if they don’t prevent credit from tightening, equities from rolling over, and some corner of the system from breaking?
That, in a nutshell, is why we devoted such a long opening section of this issue to Japan. Because if the “standard” toolkit fails, we already know what the next steps are likely to be. We’ve seen the movie.
One obvious candidate is Yield Curve Control.
If long rates in the U.S. or Europe spike and start to threaten debt sustainability, central banks can do exactly what the BoJ did: pick a yield on the 10-year and say, “It goes no higher than this.” Then they stand in the market with a printing press and buy whatever it takes to make that statement true. That’s not theory. That’s policy precedent.
And if markets really start to fall, as they may if doubts emerge about how more than $9 trillion in U.S. government debt will be rolled over in 2026…
...then we should fully expect central banks to move one notch further down the Japanese script and start buying risk assets directly. ETFs. REITs. Credit funds.Equity indices. Again, this is not wild speculation. The BoJ has already done it. Japan has already normalized the idea that a central bank can be one of the largest holders of its own stock market.
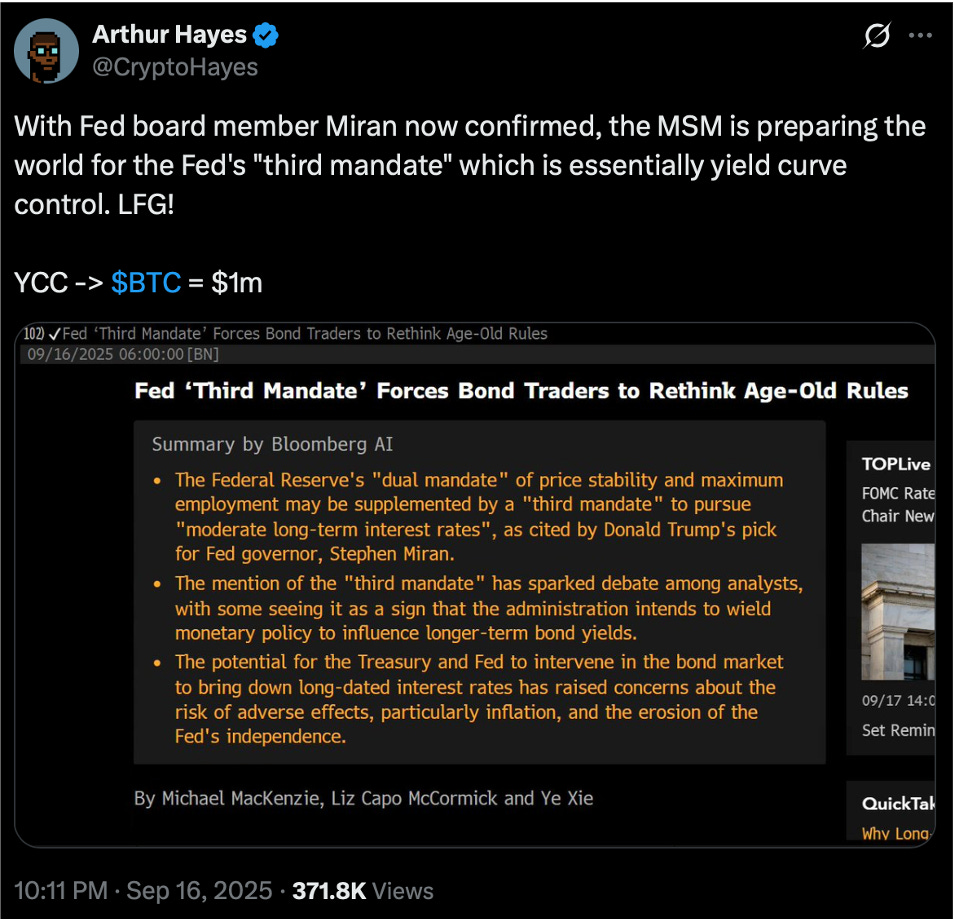
In fact, in the U.S. you’re already seeing the narrative groundwork being laid. There’s growing chatter about a de-facto “third mandate” for the Fed, not just price stability and maximum employment, but financial stability/market stability as an informal objective.
No one will write it into law, but in practice it means the Fed is expected to step in whenever asset prices or funding markets threaten to break.
That’s exactly the mindset that opens the door to YCC, and, if needed, to outright purchases of risk assets. Nothing in that playbook is “new.”
Japan has just been running it ahead of everyone else.
But here’s the key point: for these unconventional measures to be politically and socially acceptable in the West, something big has to happen first.
A crash of sorts.
Not a 5–10% pullback you forget in a month. A real break. The kind of move that can be branded an “emergency.” That’s what creates the narrative cover for things like Yield Curve Control and outright equity-buying in the U.S. or Europe: “We had no choice. The system was at risk.”
So, as long-term investors, our job is not to obsess over the crash itself. The crash is the shock. What matters is the reaction. Because if we’re right about the roadmap, when that break inevitably comes, it will most likely be temporary and it will be met with large-scale interventions., Japanese style! That’s the reaction function we should expect from today’s political and monetary authorities. And the beauty (or horror) of it is: they don’t need to invent anything new. They just have to continue copying Japan, as they’ve been doing since 2008.
How can we be so sure they’ll intervene?
Because given the record amounts of leverage the global economy now carries at every level (governments, corporates, households) letting the system truly fail is politically, socially and financially untenable. No finance minister wants to preside over a cascading default cycle. No central banker wants to be remembered as the one who “let it all burn.”
But that doesn’t mean there are no consequences.
There is always a price to pay.
And that price is at the heart of our Market View: a long, secular inflationary regime that debases money over time... a slow-motion, politically palatable way of defaulting on unpayable liabilities. You don’t tear up the debt, you just repay it in softer currency. The burden is shifted quietly into savers and wage earners. It’s easier to sell politically and socially, not because the consequences aren’t severe, but because most economic agents don’t fully understand what’s happening.
Now, if we’re saying that a major crash is the political precondition for these next-stage tools to be deployed, then it goes without saying that spotting that crash ahead of time would be immensely valuable.
And this is where the story comes full circle.
Because two of the most important tasks for us at VMF Research at this point in the cycle are:
First, to anticipate the reaction to that crash by central banks. That’s exactly what we’ve done in this issue. And if we’re right in our work on the reaction function of the Fed, the ECB and others, then the response to that crash will likely present a major buying opportunity for those who are prepared.
And second, to watch closely for the signals that flash before the break. The tells that the system is nearing a breaking point, that a deep fall is being set up, along with the ‘emergency backdrop’ needed to justify those massive interventions.
And once again, Japan is offering valuable clues about what those early warning
signals look like.
That’s where we go next.
Alarm Bells Few Are Hearing
In Part One, we wrote: “It’s precisely because deflation and ultra-low inflation persisted, and because interest rates stayed pinned near zero or below, that Tokyo was able to keep scaling these interventions without tripping the classic alarm bells.”
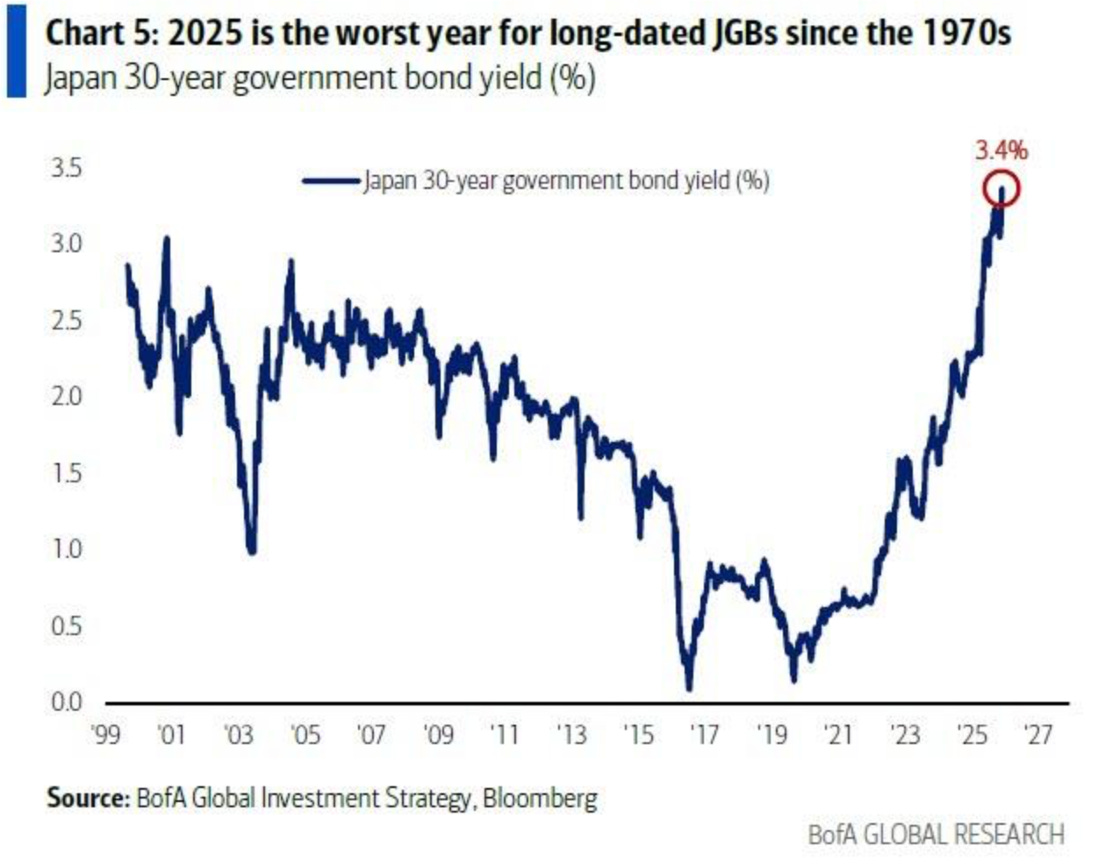
Well… those alarm bells are ringing now. Loudly. On both fronts.
We’ve just seen the yield on 30-year Japanese government bonds (which for years lived flatlined around 0%) has essentially gone vertical. After spending most of the 2010s and early 2020s hovering near nothing, ultra-long JGBs are now comfortably north of 3%, with the very long end pushing even higher. For a country whose public debt sits somewhere above 220% of GDP, this is not a curiosity on the far right of the curve.
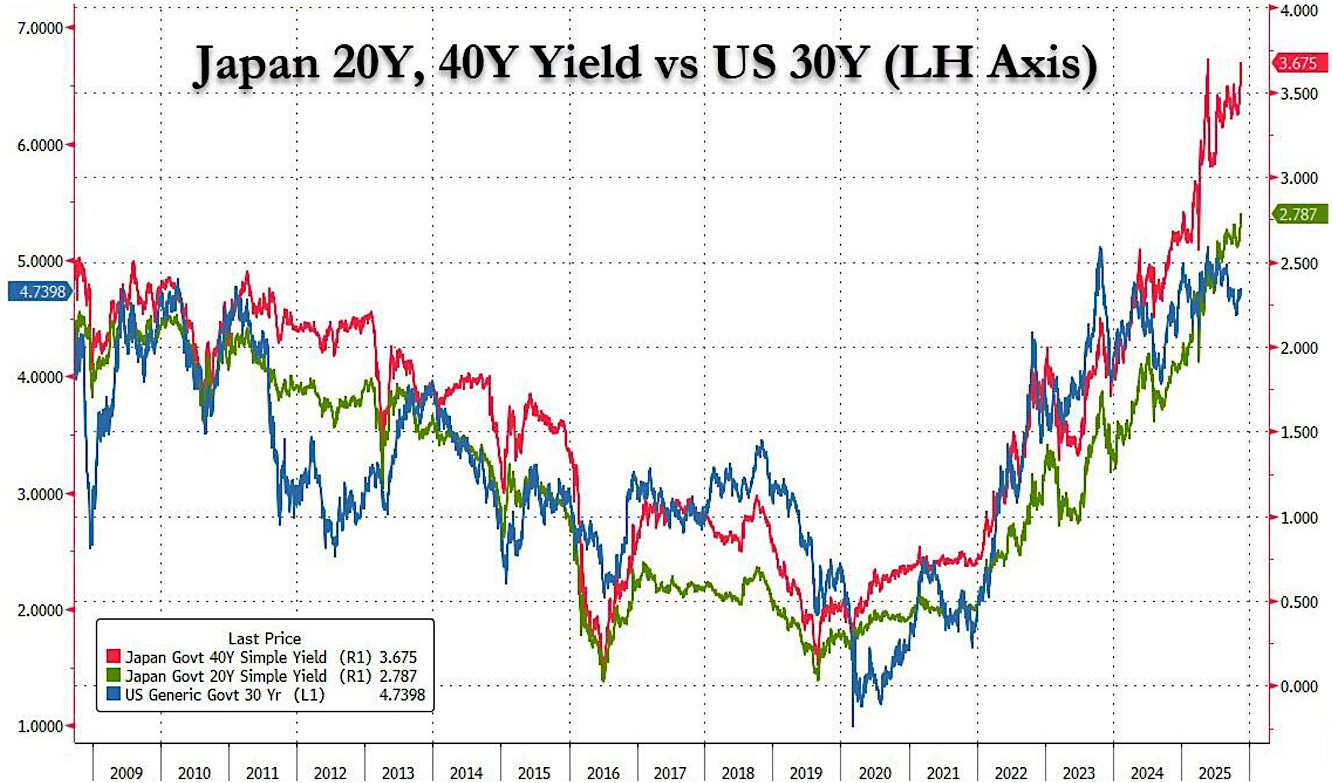
This is one of the loudest alarm bells in global markets right now. When a sovereign that leveraged itself this aggressively starts to see its long-end yields break out, we’re no longer talking about academic yield-curve diagrams. We’re talking about the price the market now demands to hold the liabilities that underpin the entire system: the government itself, the banking sector, insurers, pension funds, and by extension, everyone depending on them.
And yet, very few investors are truly watching it.
At the same time, the other pillar of Japan’s Intervention Bubble — deflation or ultra-low inflation is also shifting. For more than three decades, Japan was the global textbook case of “nothing happens”: you print money, you issue debt, and inflation stubbornly refuses to appear.
That’s no longer the story. After flirting with mild price pressures in the early 2020s, Japanese inflation finally woke up. Core prices pushed above 3%, headline readings flirted with 4%, and, crucially, they didn’t immediately collapse back to zero. Wages have started to move as well, with recent shuntō wage rounds delivering the strongest pay increases in more than 30 years.
Inflation is no longer a ghost story in Japan...
Wage growth and inflation expectations are starting to embed. The decades-long mindset of “prices don’t rise, wages don’t move” is beginning to crack. For a system that was built on the assumption that inflation would always be near or below zero, this is a regime change.
Put differently, the two pillars that supported Japan’s giant experiment (very low or negative rates and entrenched disinflation) are both starting to shake. That combination was what allowed the BoJ to grow a balance sheet bigger than the entire Japanese economy, suppress yields across the curve, and monetize an astonishing share of government debt without triggering a bond-market revolt. Now long-dated yields have broken out of their old range, inflation has spent years closer to 2–3% than to zero, and wages are finally responding.
The BoJ has already had to react: it ended negative interest rates, loosened its grip on yield-curve control, and stopped buying new stock ETFs and J-REITs. But let’s be clear: policy is still incredibly loose. Japan is normalizing from absurdly easy to merely very easy. That’s exactly what makes this moment so dangerous. The backdrop that allowed Japan to run the biggest Intervention Bubble in modern history is changing at the margin.
And in a system this leveraged, margins matter.
Which brings us to the yen, arguably the most important single variable in this entire story. For decades, Japan’s near-zero rates and chronic current-account surplus turned the yen into the world’s premier funding currency. Borrow cheaply in yen, invest in higher-yielding assets elsewhere, clip the spread. That’s the yen carry trade. As long as the BoJ kept yields pinned and the currency reasonably weak, the global carry machine could hum along. Whenever global markets wobbled, carry positions would partially unwind, money would come home, and the yen would typically strengthen, reinforcing its reputation as a safe haven.
Abenomics rewired that rhythm. From the early 2010s onward, as Japan ramped up QE and yield-curve control, the yen began a long structural depreciation, while the Nikkei launched into a powerful bull market. If you look at the charts in this issue, you’ll see it plainly: the real structural slide in the yen accelerates as Abenomics kicks in, and the Nikkei’s massive run starts at roughly the same time. The weak yen, the surging equity market, and the outsized BoJ balance sheet are three faces of the same regime.
They’re all connected.
This is exactly where Michael Gayed’s work plugs into ours. For years now, he’s been warning that Japan isn’t just another quirky macro story, it’s the heart of the global carry machine. In his writing and interviews, he argues that decades of ZIRP, NIRP, QE and YCC didn’t just distort Japan, they encouraged leverage everywhere.
As long as the BoJ caps yields and keeps funding cheap, the carry trade can roll on. But if long-term JGB yields rise and, at some point, the yen starts to strengthen sharply, the entire structure can unwind violently, forcing asset sales across the world in what he calls a global margin call.
In Gayed’s current framing, Japan has gone from “interesting structural risk” to “ticking time bomb” and, in his words, the “final boss” of this cycle. Inflation finally appearing in Japan undermines the old equilibrium because the BoJ can’t defend both the bond market and the currency forever. If it chooses the currency and allows yields to spike, it risks detonating the carry trade and its own debt dynamics. If it chooses the bond market and keeps printing, it risks an eventual disorderly move in the yen.
Either way, Japan is not just a local problem anymore.
It’s a live catalyst.
At VMF Research, we no longer treat Japan as just a historical case study, we treat it as a live early-warning system for the Global Intervention Bubble. We’re watching Japan’s long-end yields, its inflation and wage dynamics, and, above all, the behavior of the yen very closely. In Gayed’s language, Japan is the spark, the fire, when it starts, will be in everyone’s house. So, we’ll end our journey into Japan here, with the firm conviction that understanding its roadmap is about as close as you can get to having a time machine for what’s likely to unfold next.
Thank you for reading. If you enjoyed, leave a comment and subscribe below.
“Turning Japanese” was part of our November Alpha Tier. If you want to access the full content inc. the actual playbook: tickers, weights, and our month-by-month moves get the full issue now.
Join Alpha Tier @ VMF Research.
The SLR (Supplementary Leverage Ratio) is a regulatory capital measure that requires large banks to hold a minimum amount of tier 1 capital against all of their on balance- sheet exposures, regardless of risk (including “safe” assets like reserves and U.S. Treasuries). When regulators loosen the SLR (for example, by temporarily excluding reserves or Treasuries from the denominator, or by lowering the required ratio) banks effectively free up balance-sheet capacity. That makes it easier and cheaper for them to hold and intermediate government bonds, expand lending, and make markets in repo and other funding channels. In plain terms: a looser SLR relaxes a hard regulatory constraint and thus improves system liquidity, even if policy rates haven’t moved.