
Gold, Silver… and Gravity: Why We Trimmed Winners in a Running Bull
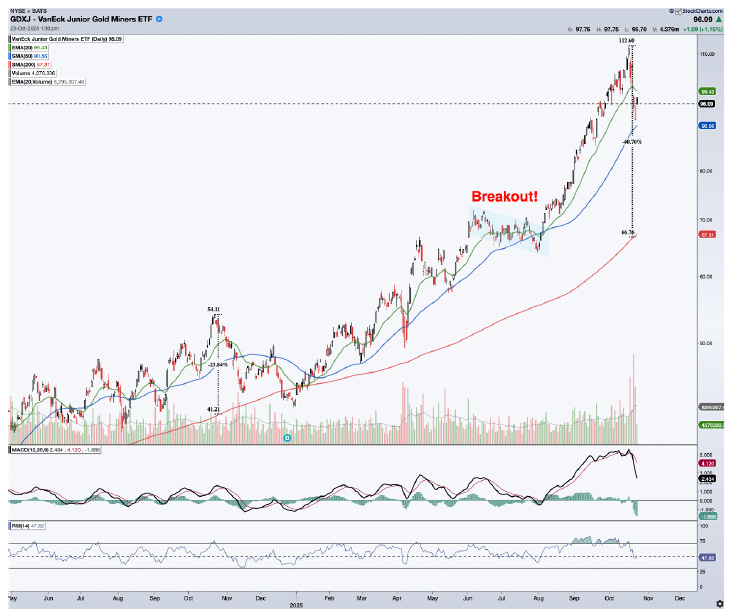
Our precious metals book is up big (GDXJ +112.7%, PHYS +71.7%). We remain bullish, but have tactically reduced exposure because gold, silver, and miners are historically overextended compared to their
The setup: big gains and a smarter risk budget
Let’s call it what it is: this has been one of the cleanest trends of the year. In our Model Portfolio, gold, silver, and the junior miners delivered standout returns with low drawdowns, exactly the profile we wanted for the debasement trade. But strong doesn’t mean straight up forever. In October, we booked a >100% gain on half of GDXJ, and earlier this year, we trimmed two percentage points of gold exposure. We’re not walking away from the thesis; we’re taking the tape’s gift and tightening risk while the rubber band is taut.
Why now? Because the technical stretch is extreme across several timeframes. We love momentum when it’s healthy. We don’t love parabolic slopes into crowded positioning with sentiment indicators flashing warning signals .
What’s driving the run (and why it’s not “just sentiment”)
Our core thesis hasn’t changed. The policy mix still leans toward fiscal expansion, structurally easy real rates, and a drift toward Fiscal Dominance, which tends to erode currency purchasing power over time. That’s a tailwind for scarce, hard assets like gold and silver. Meanwhile, ETF and fund inflows show the crowd is finally rotating into the space, which helps the tape but also raises near-term shakeout risk.

Macro still supports higher precious-metals prices over the cycle, but near-term positioning and technicals argue for better entry points if you’re adding… and for risk trims if you’re already long.
Why we trimmed: the stretch is historic
You don’t need exotic indicators here. Simple works:
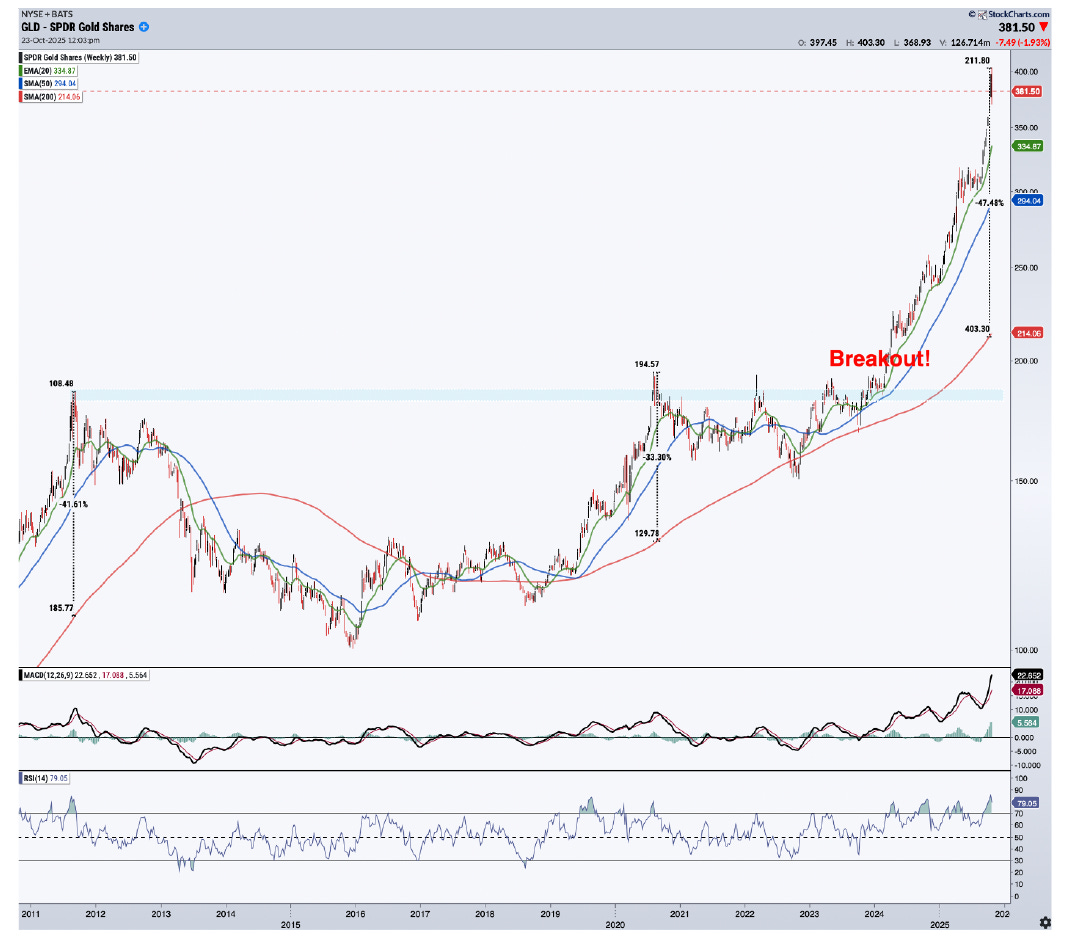
Gold (monthly): at prior peaks (2011, 2020), spot topped out ~41.6% and ~33.3% above the 200-month MA. Today: ~47.5% above. That’s rarer air than 2011. Rubber band, meet physics.
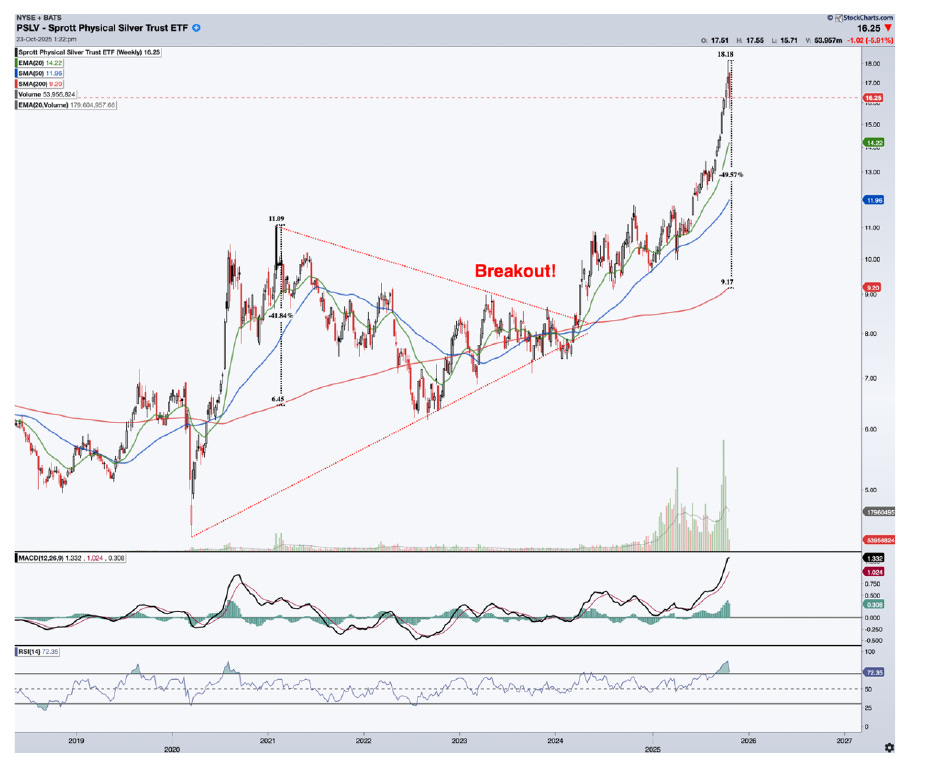
Silver (weekly): at the 2020 high, silver sat ~41.8% above its 200-week MA. Today: ~49.6% above. Silver moves quickly in both directions; manage size accordingly.

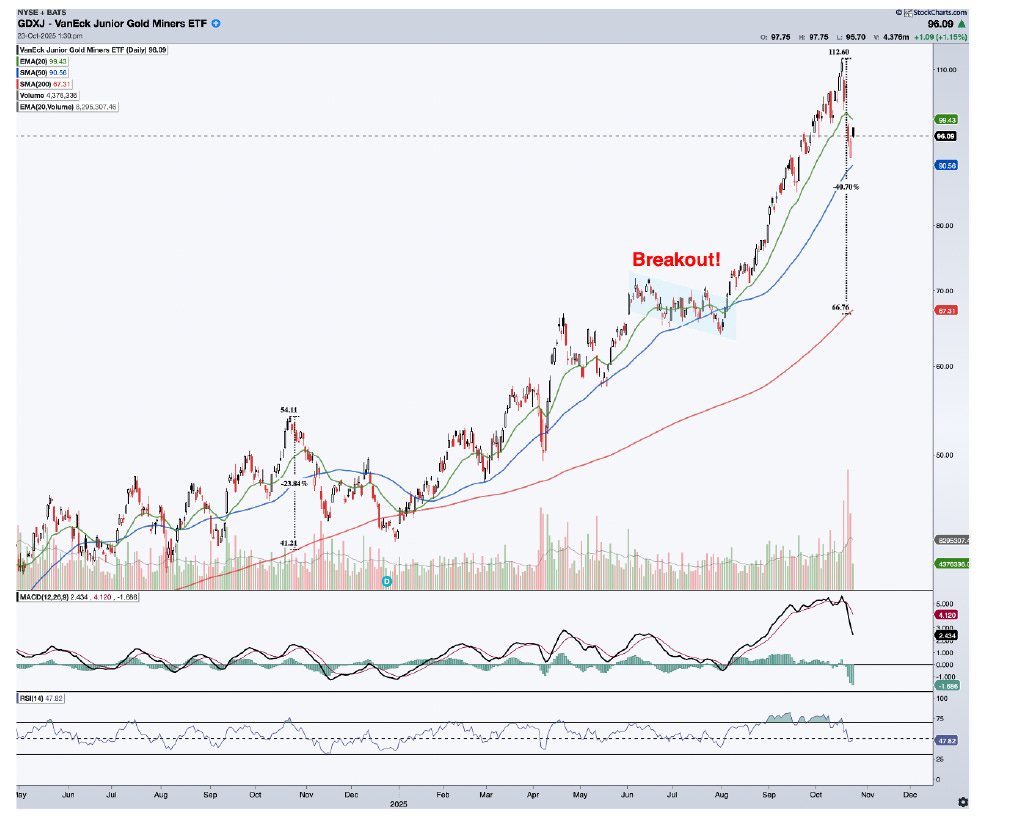
GDXJ (daily): before the latest pullback began, price was ~40.7% above the 200-day MA, a record gap. That’s where shakeouts like to start. We trimmed half after a >100% gain.
None of these signals calls the ultimate top. But they raise the odds of a cool-down: sideways digestion, a deeper visit to rising support, or a sharp “noisy” shakeout that tests conviction. Our job isn’t to predict the exact tick… it’s to keep asymmetry on our side.
Trimming into strength does that.
Signals we’re watching next (and where we’ll re-add)
1) Distance-to-trend resets
We will gladly re-add as gold and silver compress toward key anchors (200-day and 200-week). The ideal moment is when the setup aligns with the verdict of the Technicals pillar in our proprietary Investment Process, where we use a disciplined toolkit that spans cycle work and Elliott Wave as well as classic trend, momentum, and breadth analysis.
2) Positioning and flows
ETF inflows have surged across the precious-metals complex, which is a clear Sentiment signal. We prefer to wait for the pendulum to swing back, with cooler flows, a cleaner COT profile, and less crowding, so that entry asymmetry improves.
3) Liquidity backdrop
Tight market plumbing has increased the odds of an air pocket in risk assets. When the Federal Reserve eases the squeeze, balance-sheet actions matter more than token rate cuts. Our Liquidity work suggests a more favorable backdrop ahead, which should support the next leg for gold and also for liquidity-sensitive assets, such as crypto.
4) Process alignment (all five pillars)
Re-adds must clear our complete framework: Technicals, Fundamentals, Sentiment, Macro, and Liquidity. We covered the three above. Macro includes analysis of economic cycles, inflation, and interest rates. For Fundamentals in precious metals, we focus on miners’ margins, capital expenditures (capex), and supply and demand dynamics, among other key factors.
This five-pillar approach is what we deliver in every monthly newsletter, providing objective signals and the evidence behind our decisions.
How we’re positioned
Our Investment Process still points to a constructive 12–24 month outlook for precious metals. We remain overweight. We trimmed into strength because the same disciplined process flagged stretched conditions and told us to protect capital.
We didn’t abandon the thesis; we executed it. And when the signals turn (across Technicals, Sentiment, Liquidity, Macro, and Fundamentals), the process will give us the confidence to add back size.
If you want the full chart pack, our preferred entry zones, and the portfolio tripwires we monitor, you’ll find them in the weekly updates and the newsletter. Subscribe to VMF Research today.
We publish independent, evidence-based work. No hype, just process. (And yes, we eat our own cooking.)
Disclaimer
The information provided herein is for general informational purposes only and does not constitute financial advice or a recommendation to buy, sell, or hold any investment. It is not tailored to any specific individual or investor profile. All investments involve risks, and past performance is not indicative of future results. Before making any investment decisions, it is important to consider your own financial situation and risk tolerance. We do not guarantee the accuracy, completeness, or reliability of any information provided, and we disclaim any liability for any loss or damage arising from reliance on the information herein. Readers are advised to consult with an authorized financial intermediary before making any investment decisions.
It’s refreshing to see disciplined execution rather than blind conviction. Taking profits and tightening risk while sentiment and technicals go vertical is how many pros stay in the game. Also, may traders can benefit from the reminder that “strong doesn’t mean straight up forever.”