

The last two weeks have been extraordinary.
Wall Street’s biggest winners are suddenly taking the biggest beating. Corrections are unfolding at remarkable speed. And money is rotating towards the very stocks investors had spent months ignoring.
When we first published October’s VMF’s Strategic Asset Allocation, Yielding to Pressure, on 9 October 2026, the warning signs were already there.
We had examined the relentless rise in Treasury yields, an investigation we have since shared publicly. But the stock market was telling an equally troubling story.
Only 28% of S&P 500 constituents were trading above their 50-day moving averages.
The rally was resting on remarkably few shoulders.
That fragility helped explain why we saw a growing need for protection, ultimately introducing a small ultra-long-duration Treasury hedge later in the issue.
But here was the complication.
Corporate earnings were accelerating. Professional investors were already cautiously positioned. Sentiment had only just recovered from Fear to Neutral. And the historical pattern around US midterm elections offered reasons to expect a stronger market into year-end.
There were good reasons to be nervous. And equally good reasons not to abandon the bull market.
Two weeks later, the market is putting both arguments to the test.
Is this violent rotation laying the foundations for a healthier advance? Or is something more serious unfolding?
That is precisely the question we tackle in October’s Alpha Tier.
For now, here is the investigation we published on 9 October, before the rotation gathered speed.
Good reading.
Higher borrowing costs are already leaving their mark on equities. You simply have to look beneath the headline indices to see it. As we have established, the rise in yields extends across government debt and into corporate credit, with lower-quality borrowers facing particular pressure. Yet the S&P 500 remains close to its highs, while the Nasdaq ( NDAQ 0.00%↑ ) has pushed higher.
For anyone watching only those benchmarks, the equity market appears remarkably untroubled.
For investors holding many of the companies inside them, the experience has been considerably less comfortable.
Understanding this divergence is essential to our allocation decisions. It explains both why we remain constructive on selected equity exposures and why we are watching the bond market so closely.
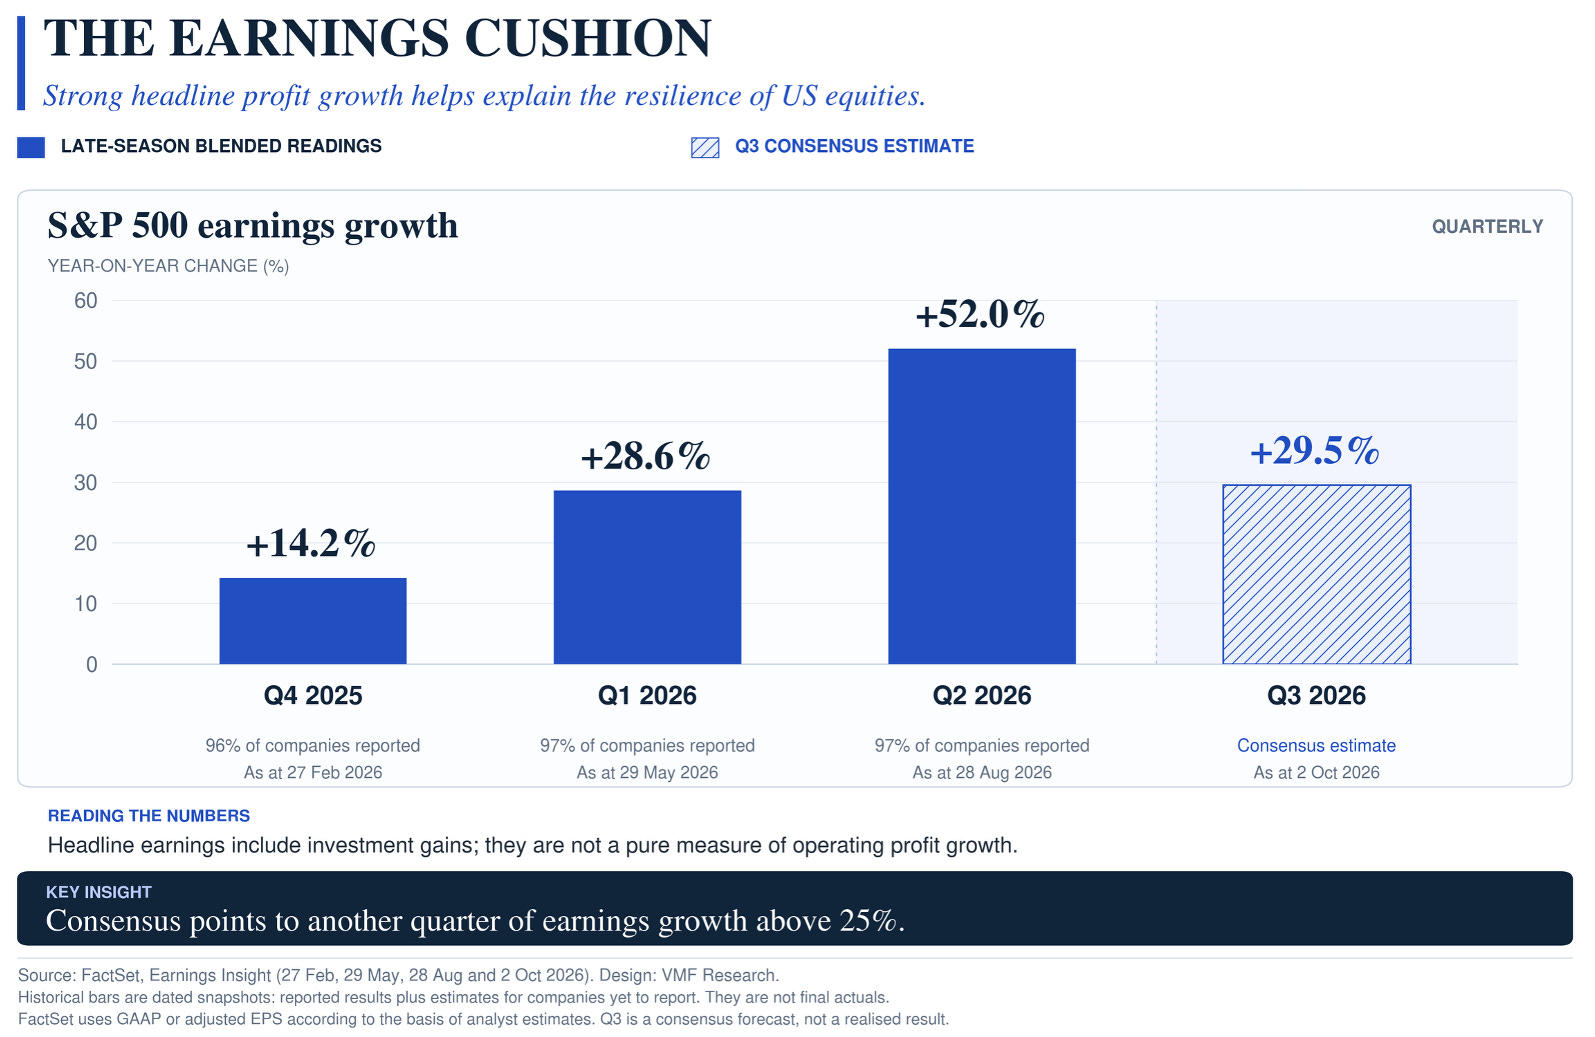
The starting point is earnings. FactSet’s late-season readings show S&P 500 year-on- year earnings growth accelerating from approximately 14% in the fourth quarter of 2025, to 29% in the first quarter of 2026, and 52% in the second. Those headline figures require some qualification, which we will address shortly. Nevertheless, the acceleration is substantial.
Looking ahead, the consensus entering October expects third-quarter earnings growth of 29.5%. Analysts raised their estimates during the quarter, rather than making the reductions that typically accompany the approach of reporting season. Meanwhile, the index’s forward price-to-earnings ratio fell from 20.4 at the end of June to 19.0 at the end of September.
This helps explain how an index can withstand higher yields.
Investors may become less willing to pay a high multiple for each dollar of future earnings, while simultaneously expecting companies to produce more of those dollars.
The economy provides support for that expectation. Second-quarter real GDP expanded at a 2.2% annualised rate, while private domestic final demand, covering consumer spending and private fixed investment, grew at 4.6%. These figures describe an economy still generating meaningful demand.
There is, however, a difference between strong earnings and equally strong earnings everywhere...
Goldman Sachs estimates that AI investment accounts for almost half of the S&P 500’s earnings growth this year. That spending supports a network of businesses extending from semiconductors and equipment to infrastructure and power. A significant share of the incremental profit pool is therefore connected to a common investment cycle.
Some headline profits also reflect increases in the value of investments held by large technology companies. Goldman estimates that unrealised gains on private-company stakes represented approximately 12% of the S&P 500’s second-quarter earnings. That is a share of the earnings level, rather than a contribution of twelve percentage points to earnings growth.
An investment becoming more valuable can enrich its owner. It does not automatically create recurring cash flow from selling more products, serving more customers or operating more efficiently.
We therefore want to see the operating businesses continue to deliver.
There is evidence that they are. FactSet’s late-August reading showed earnings growth of approximately 32% among the S&P 500 companies outside the Magnificent Seven. The earnings expansion reaches beyond the largest technology-related businesses, even though their contribution remains disproportionate.
That distinction becomes particularly revealing when we turn from corporate results to share prices.
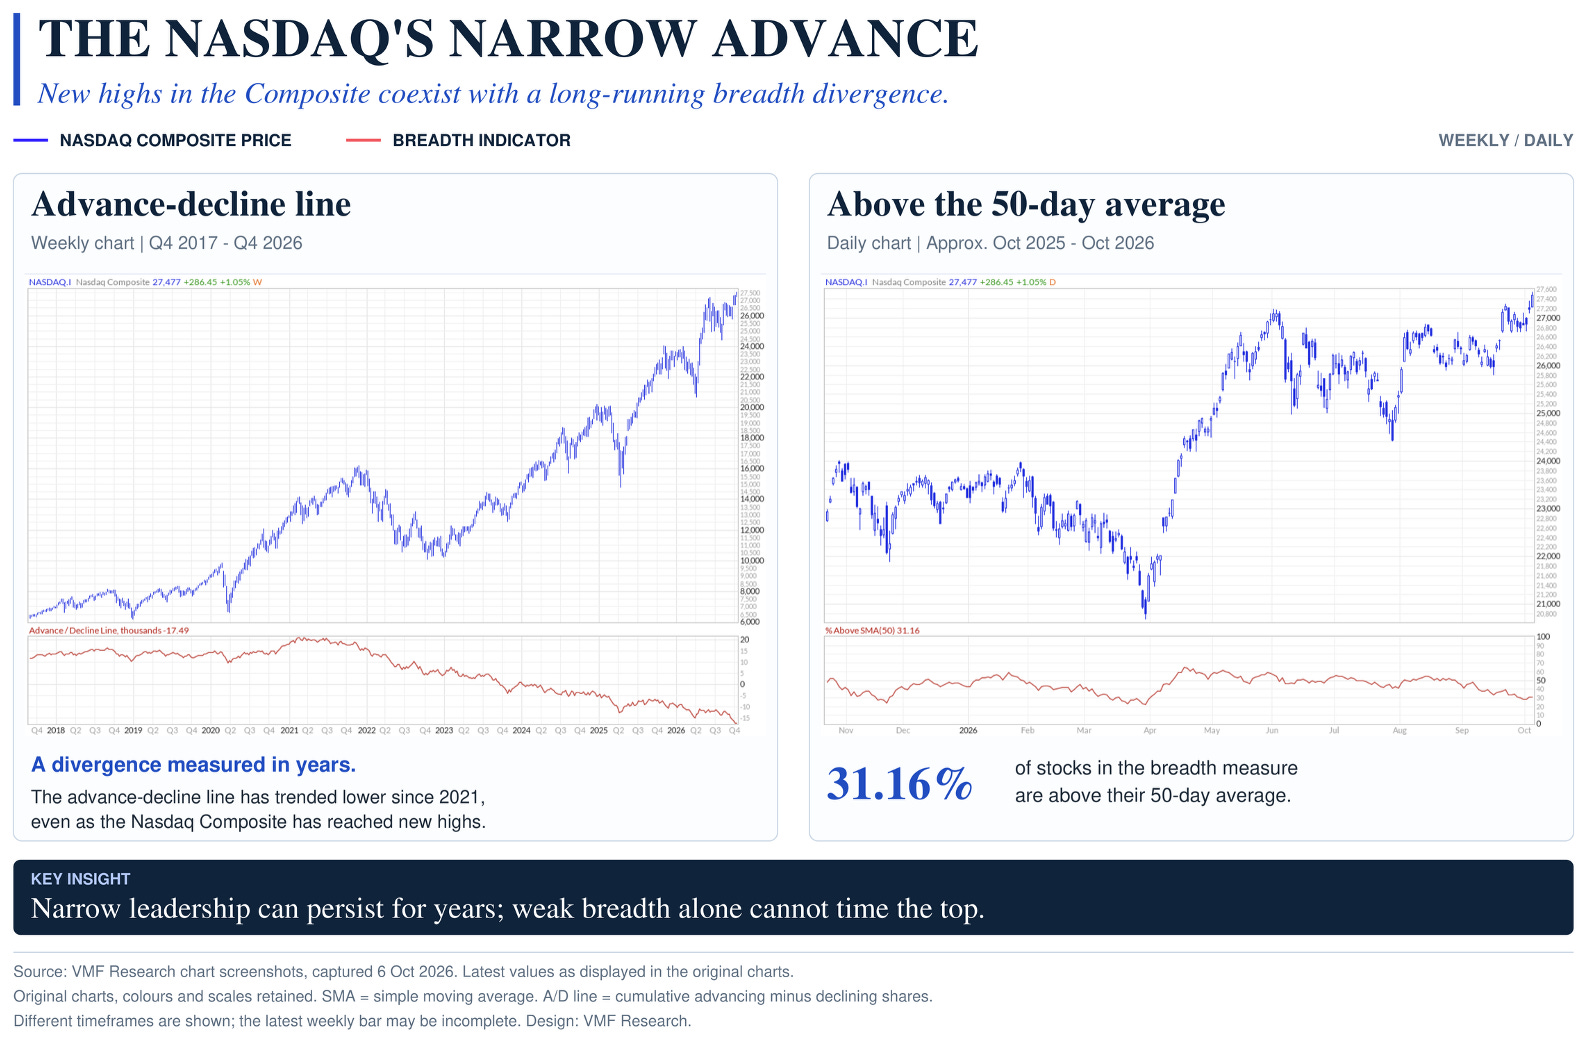
By 5 October, only about 28% of S&P 500 constituents were trading above their 50- day moving averages. In the Nasdaq, the figure was approximately 31%.
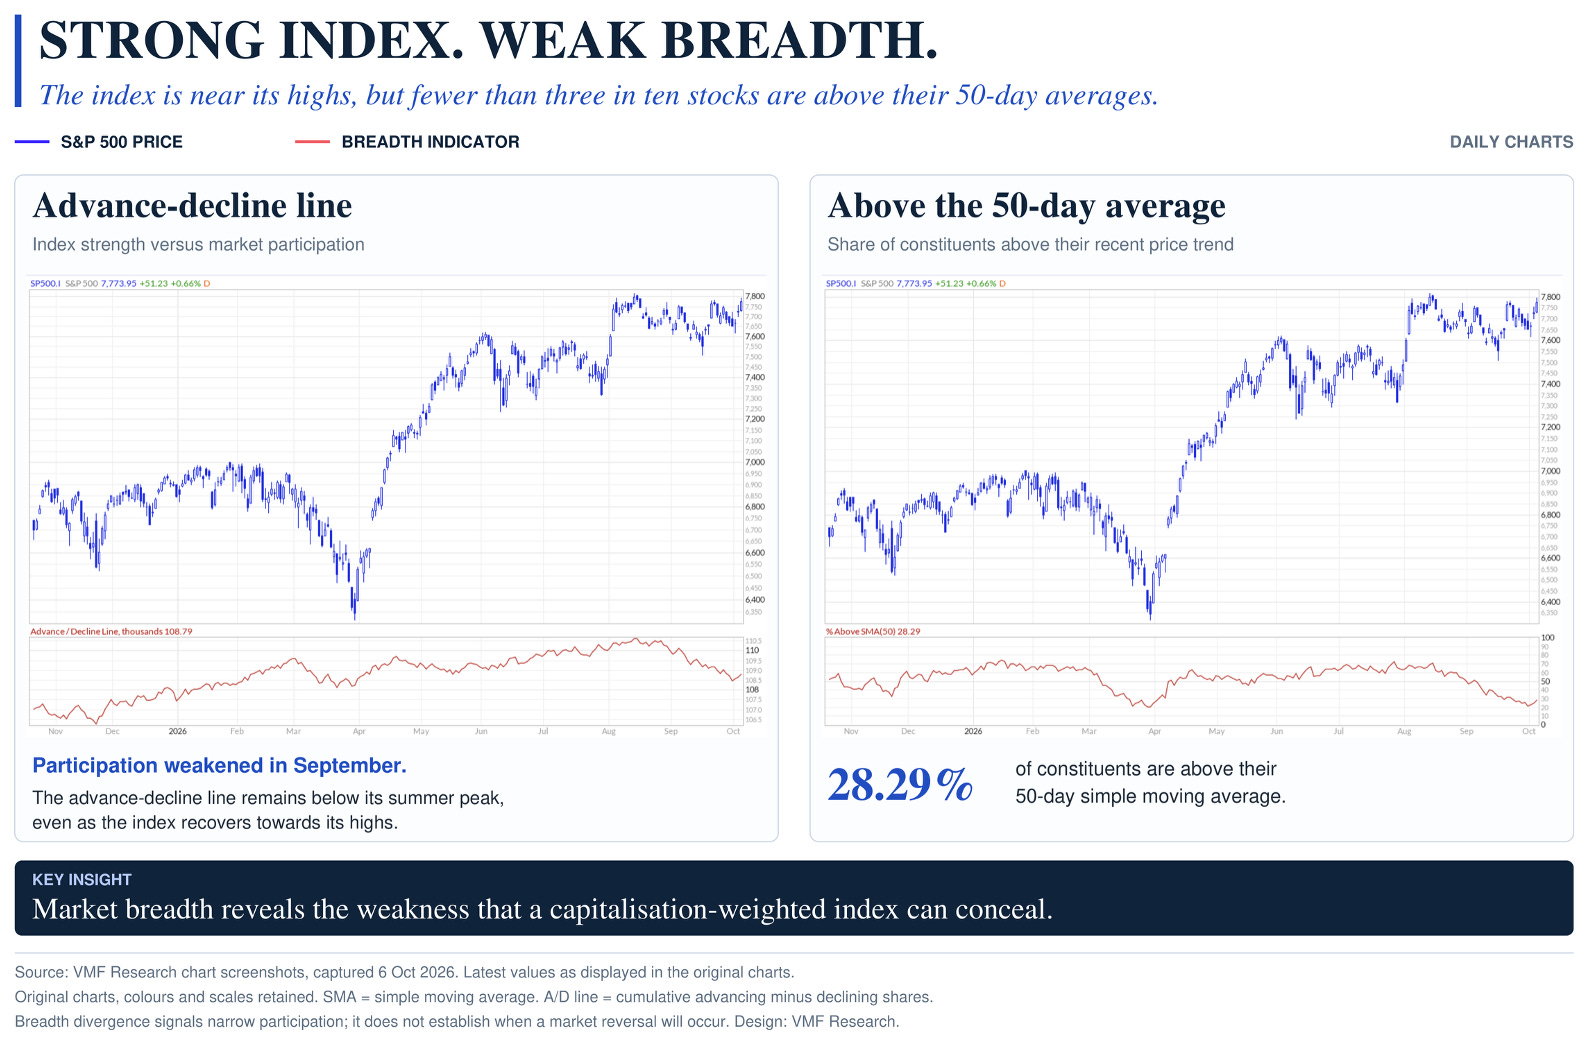
Put simply, around seven out of ten stocks in these breadth measures were trading below their average prices over the previous ten weeks, despite the strength of the headline indices.
The advance-decline lines reinforce the warning.
These indicators accumulate the difference between the number of advancing and declining shares, giving each constituent a voice that its market value might otherwise drown out.
For the S&P 500, participation deteriorated sharply during September. The Nasdaq’s longer-term chart shows a divergence that has persisted across a much longer period.
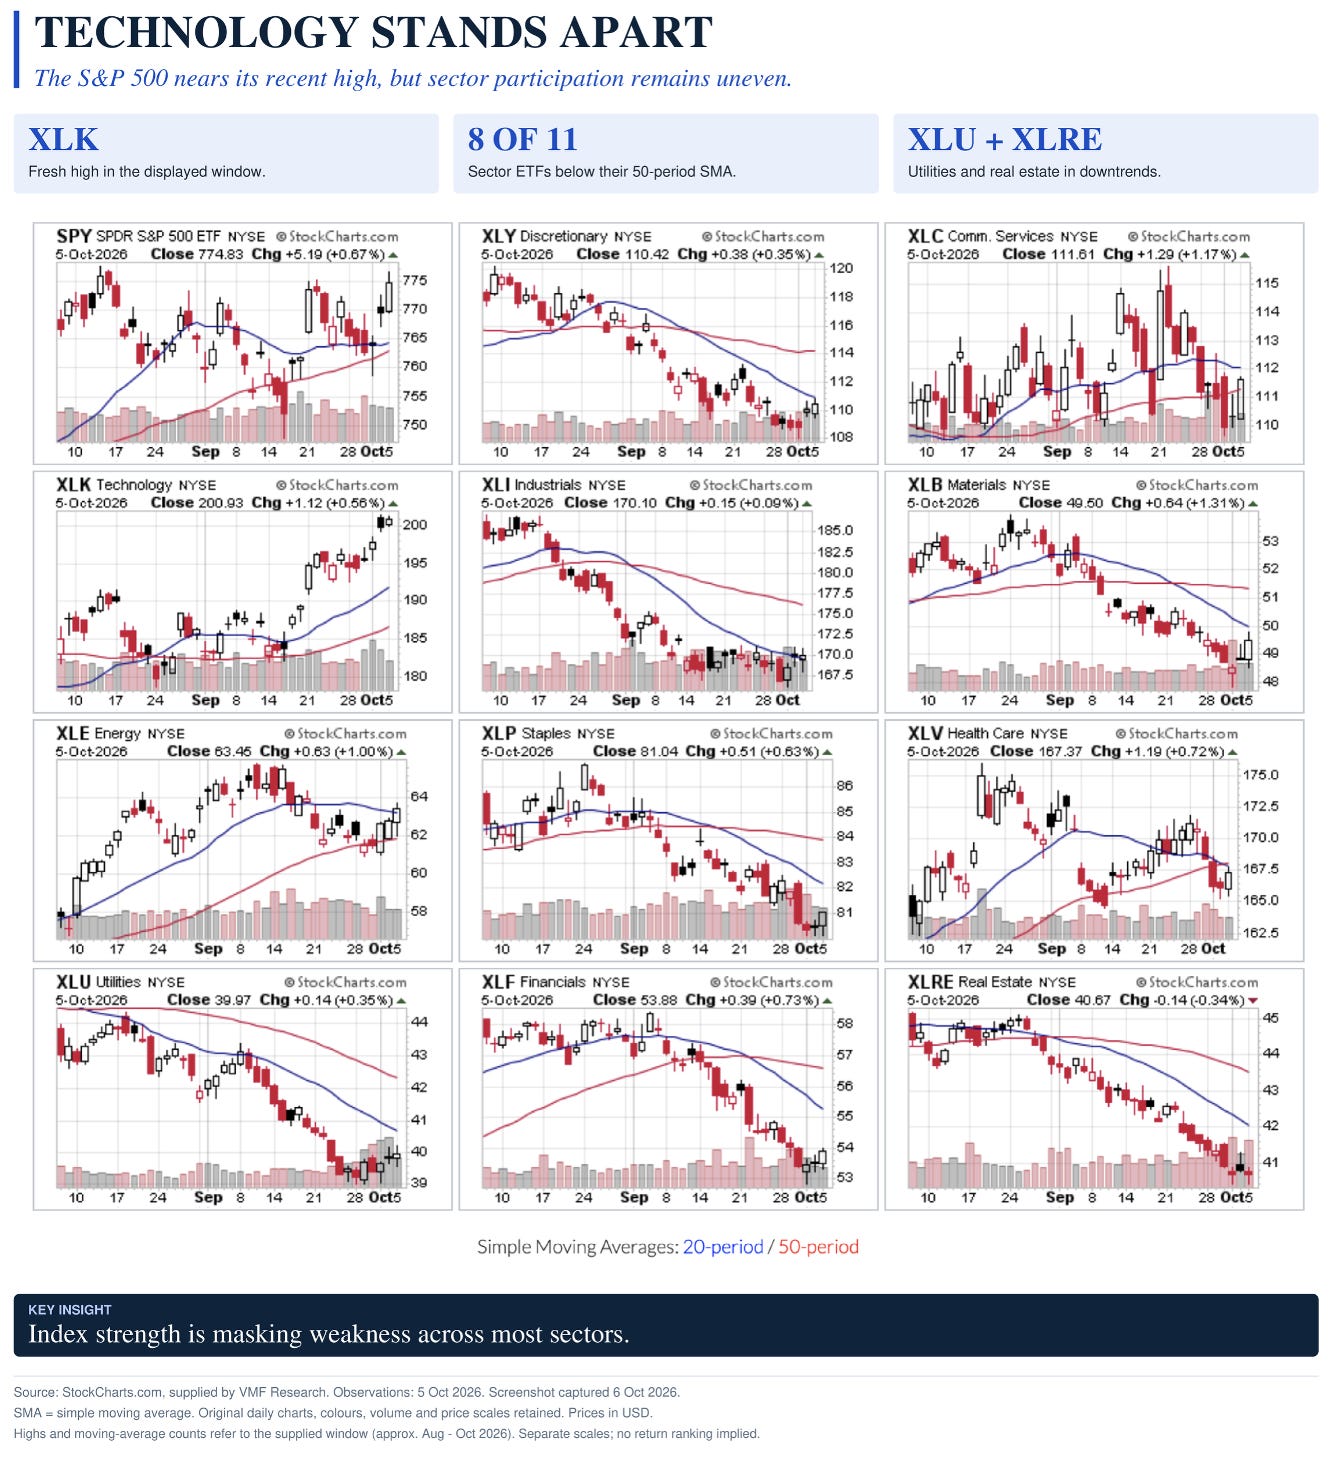
The sector dashboard on the next page makes this weakness tangible.
Technology is the only sector clearly pushing to fresh highs in the window shown.
Most other sectors have retreated, with pronounced weakness in real estate and utilities. Consumer discretionary shares, industrials and financials have also struggled. Energy has shown greater resilience, while communication services presents a more mixed picture.
Higher yields help explain part of this dispersion.
Debt becomes more expensive to refinance. Capital-intensive projects face higher financing hurdles. Dividend-paying equities must compete with increasingly attractive bond yields.
Those pressures differ considerably between businesses. A company financing expansion from its own cash generation faces a different constraint from one that must repeatedly approach lenders or shareholders for fresh capital.
The cost of money is rising, and the market is becoming more selective about which businesses can overcome it.
We take this concentration seriously. A market dependent on fewer leaders has fewer sources of support if those leaders disappoint.
But concentration has been a recurring feature of the market since we began publishing in May 2024, and for some time before. Its persistence is visible in the Nasdaq’s advance-decline chart. It has warned us about the character of the advance without providing a reliable date for its end.
Selling simply because leadership is narrow would have repeatedly taken us away from the businesses attracting capital.
The more useful question is what investors are rewarding.
Our interpretation remains closely connected to the Abundance Shock: technological progress that expands productive capacity, lowers the cost of performing important tasks and creates new commercial opportunities.
At first glance, the resilience of innovation-related equities may seem especially surprising. Businesses whose valuations depend heavily on profits many years into the future should be sensitive to higher discount rates.
They are. But the discount rate is only one part of the valuation.
If investors raise their expectations for future revenues, margins or market share sufficiently, the improvement in expected cash flows can outweigh the pressure from higher yields. A bond’s contractual payments are largely fixed. A business can change what it earns.
We believe this helps explain why selected innovation exposures continue to attract capital even as much of the market struggles.
Our Model Portfolio has participated in that process. We closed our South Korean equity position earlier this year with strong gains. More recently, IGV and ARKK have carried forward the outperformance within our innovation exposures.
Their strength is consistent with our thesis, although the underlying investment cases differ. Software businesses must demonstrate that AI strengthens demand and business economics. Disruptive businesses must convert technological promise into adoption, revenues and ultimately sustainable cash generation.
The transition from building new capabilities to earning attractive returns from them remains the central test.
Price strength encourages us to keep investigating. Improving operating results give us grounds to maintain conviction.
There is also a tactical reason to remain constructive: several important groups of investors have approached this advance cautiously.
Goldman’s latest prime brokerage observations place net exposure among US fundamental long/short hedge funds near the bottom of its five-year range. Its broader sentiment indicator has also remained negative.
That restraint among professional investors finds an echo in the broader market mood.
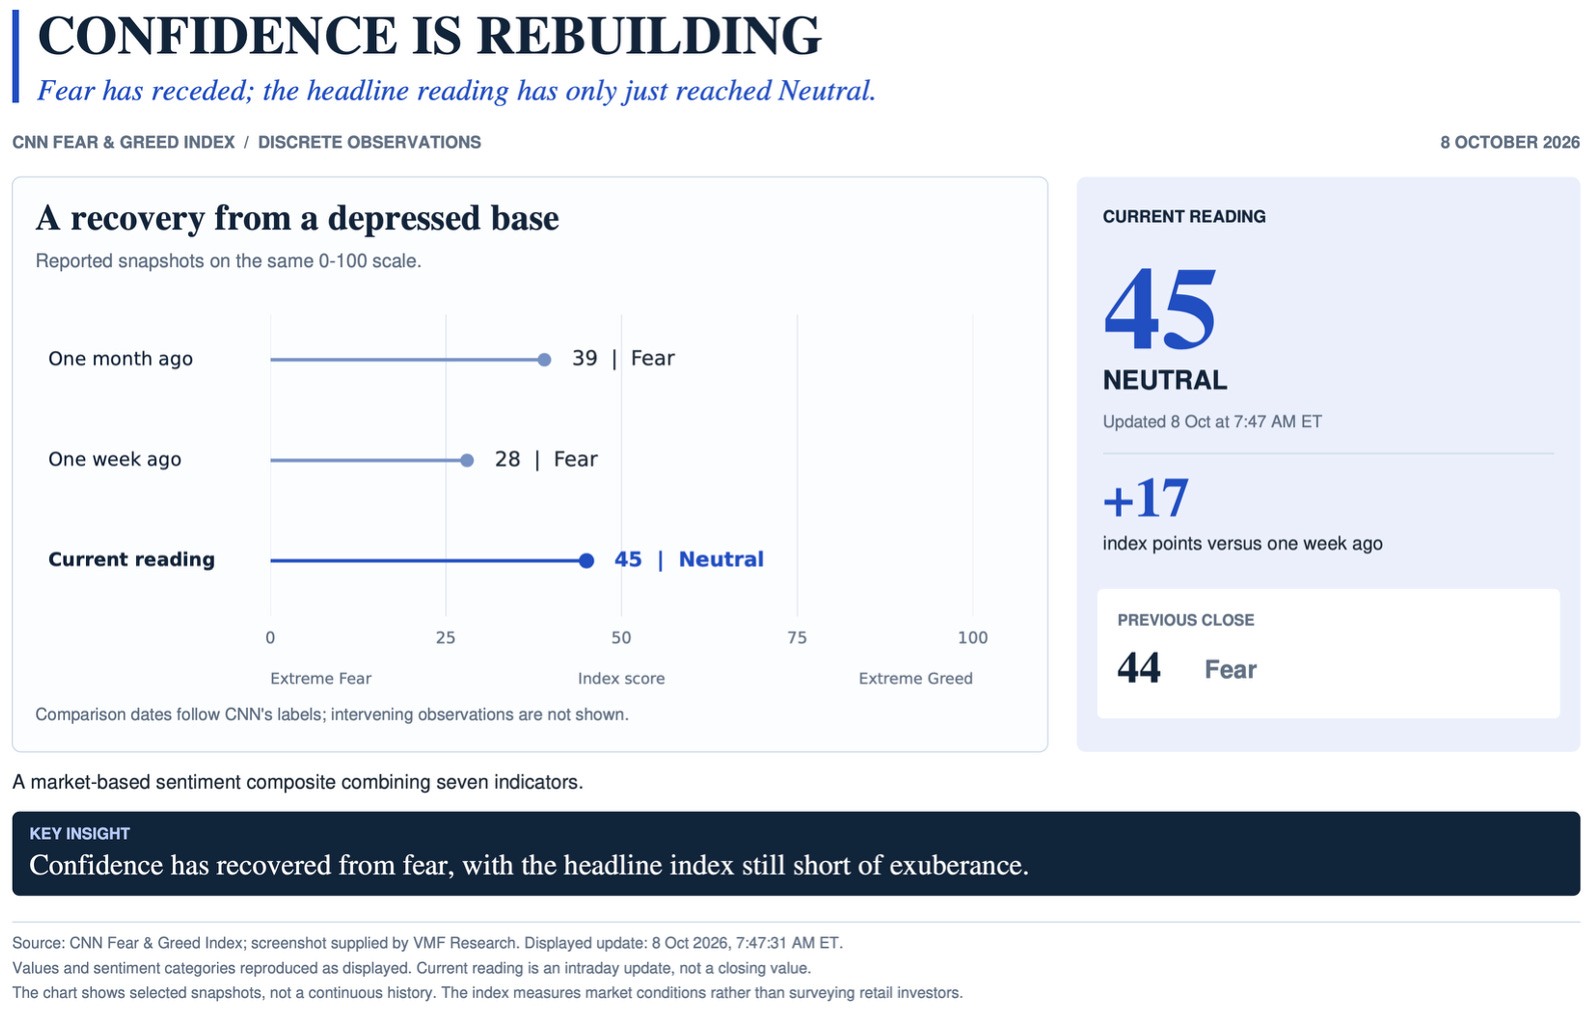
CNN’s Fear & Greed Index, a market-based gauge widely followed by individual investors, has recovered from 28 a week ago to 45 on 8 October, moving from Fear into Neutral. Confidence is rebuilding from a depressed base. Yet the headline reading remains some distance from the exuberance that would make us more concerned about an exhausted rally.
This is a potentially constructive combination: prices have remained resilient while investors are only beginning to feel more comfortable owning them. Further gains would not require sentiment to recover from an already elevated starting point.
But the composition of that recovery is more revealing than the headline.
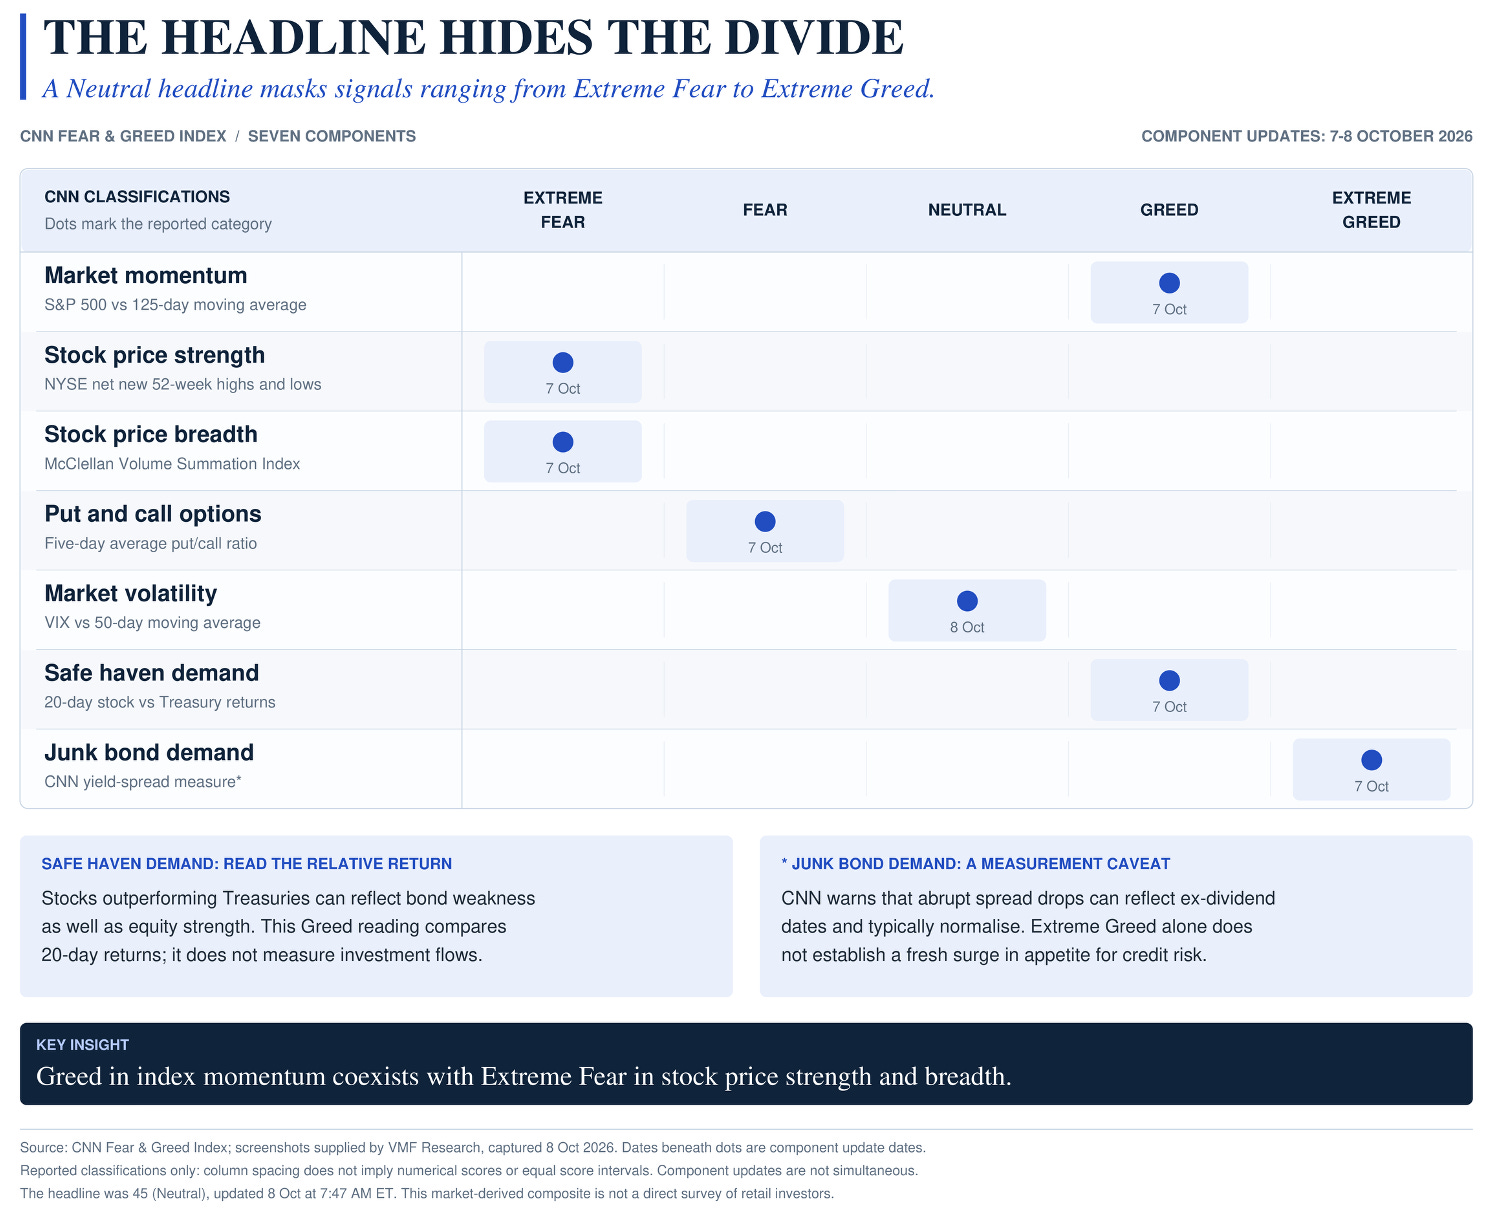
Market momentum registers Greed, while stock price strength and breadth remain in Extreme Fear. Options positioning signals Fear, volatility is Neutral, and the junk-bond component reads Extreme Greed.
The composite looks balanced because powerful, conflicting signals offset one another.
Beneath that average sits the same fractured market we have been examining throughout this section: strength in the index, weakness across much of the opportunity set, and very different assessments of risk across asset classes.
Even the labels require interpretation...
The Junk-Bond component concerns a yield differential, so its optimistic classification can coexist with higher absolute borrowing costs. It does not establish that financing conditions have become easier.
The Safe Haven Demand component offers an even more striking example. It compares stock and Treasury returns over the preceding 20 trading days. Stocks outperforming bonds pushes the reading towards Greed. But that gap can widen because Treasury prices are falling, as well as because equities are advancing. The indicator measures relative performance, not flows into and out of safety.
In the regime we have just described, government bonds are themselves under pressure. An asset investors would traditionally expect to provide shelter has become a source of losses. Some of what the indicator classifies as confidence may therefore reflect discomfort with the refuge itself.
For us, the investment implication is that confidence still has room to improve. That creates the possibility of additional buying if earnings deliver and the pressure from interest rates begins to ease.
Our view remains that the path of least resistance is higher. And we continue to believe in the Dovish Shock thesis: the possibility that policy proves less restrictive than investors have come to fear.
In our assessment, the bar for a Fed message to be received as constructive has fallen. The surprise need not begin with a rate cut. Less urgency to tighten further, greater recognition of the restraint already imposed by higher borrowing costs, or clearer evidence that inflation pressures are easing could change the market’s calculation.
What matters is the difference between the message and expectations. A pause already anticipated by investors would offer little surprise on its own. More consequential would be a reassessment of how much tightening remains ahead.
The confirmation would come through markets: stabilising yields, lower bond volatility and improving participation beyond the current leaders. Persistently rising yields accompanied by deteriorating earnings would challenge our view far more seriously than narrow breadth alone.
The calendar provides a constructive backdrop for that test.
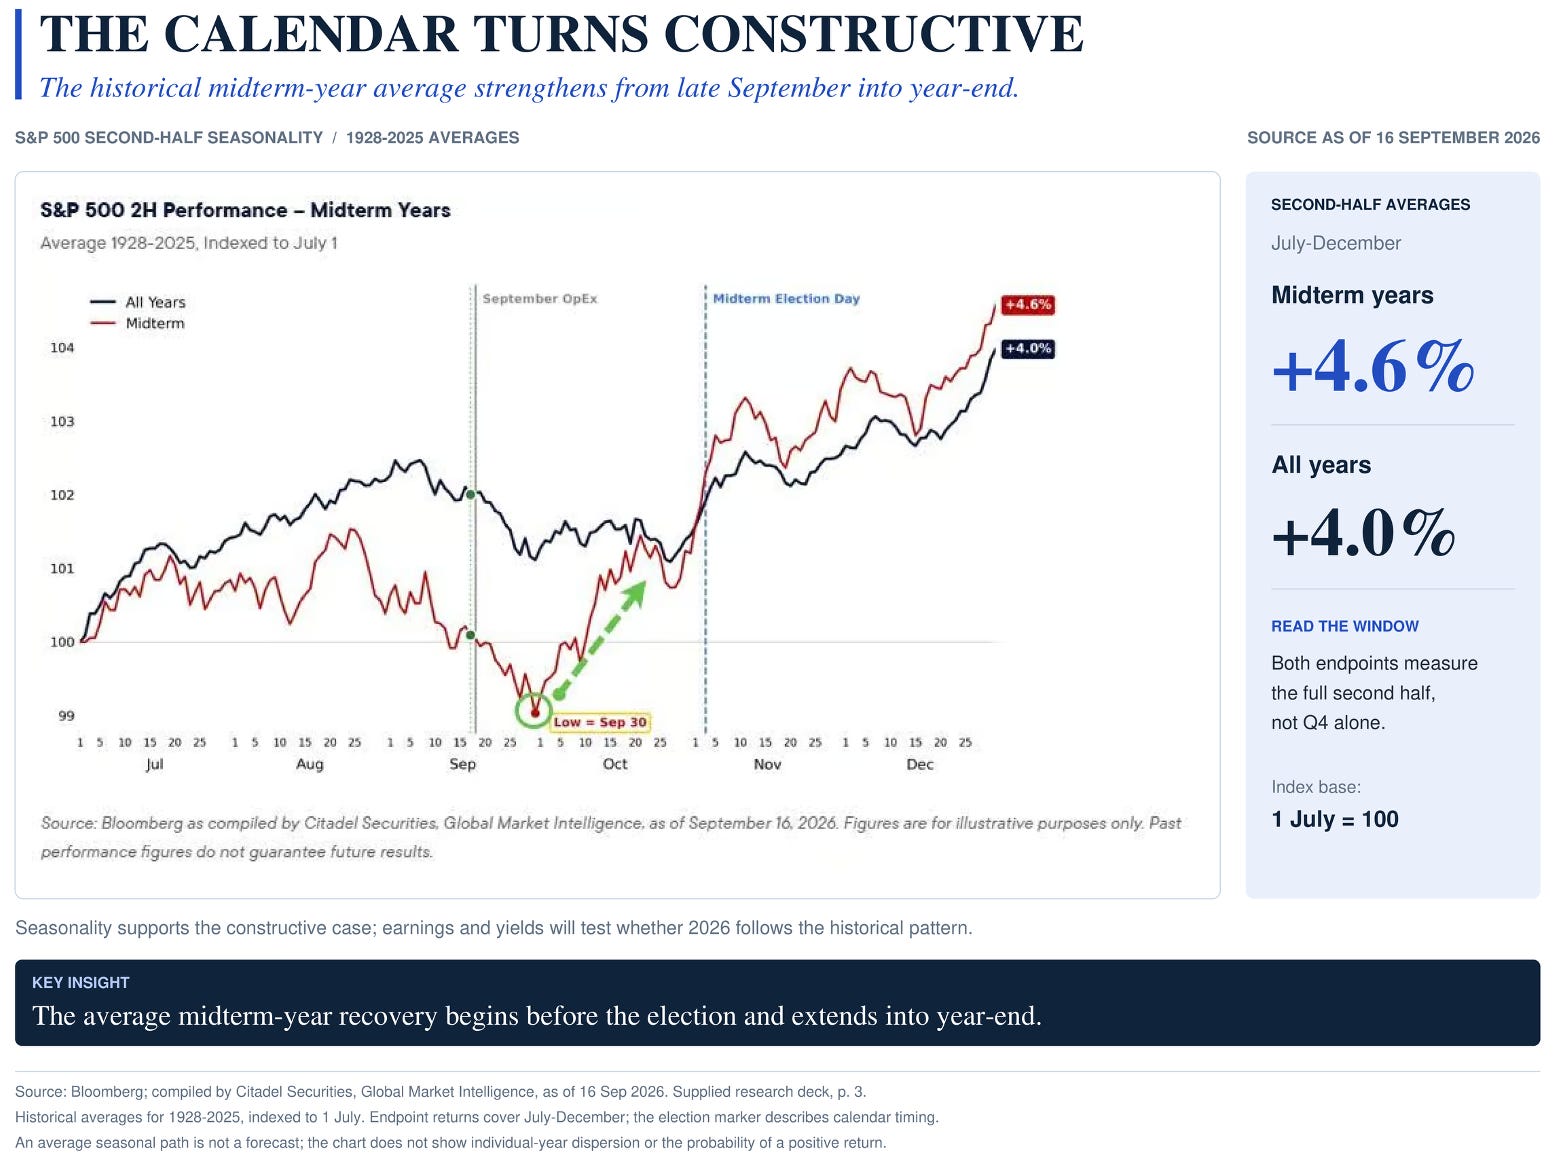
The S&P 500’s historical average in midterm years shows a second-half trough around the end of September, followed by a recovery that begins before the November election and extends into year-end.
On that average path, the best buying opportunity comes before the vote, while political uncertainty remains unresolved. The exact bottom is only identifiable in hindsight, and individual years can depart from the average. But the pattern supports our constructive view as we enter the final quarter: waiting for greater clarity can mean paying a higher price.
Earnings season will now give investors something more concrete to judge. The questions extend beyond whether the largest AI beneficiaries can beat expectations again. Can their guidance sustain confidence in the investment cycle? Are other businesses beginning to participate? And can revenue growth and margins withstand the higher cost of capital?
Strong answers could reinforce existing leadership while giving investors a reason to broaden their exposure.
Trump’s political calendar adds another incentive for supportive headlines. With control of Congress at stake, we expect the administration to place increasing emphasis on promises of stronger growth, lower costs and measures that support business confidence. Such announcements could influence markets well before their economic effects become visible.
But the response may differ across asset classes. A proposal welcomed by equities could unsettle bond investors if it implies more borrowing or renewed inflation pressure. Political incentives favour reassuring voters; they do not guarantee reassuring creditors.
That leaves us entering the final quarter with improving sentiment, restrained professional positioning and a historically supportive seasonal backdrop. Earnings and policy will determine whether those conditions translate into a broader advance.
The most consequential catalyst may still come from the market that has been causing the greatest discomfort.
If government yields begin to stabilise, equities could gain breathing room. For our Model Portfolio, however, there is a second question: has the repricing also made long-duration Treasuries attractive enough to increase our fixed-income allocation?
That is where we turn next.
Important Disclosure
This article contains general investment research produced by Vasco Marques de Freitas, CFA, CMT, Founder and CEO of VMF Research, Lda. It reproduces “A Narrow Road Higher” from the October 2026 issue of VMF’s Strategic Asset Allocation. The underlying research was completed on 9 October 2026 at 4:00 p.m. Eastern Daylight Time and first disseminated to paid subscribers on 9 October 2026 at 9:00 p.m. Eastern Daylight Time. Introductory commentary concerning subsequent market developments was added for public republication and should be distinguished from the original analysis. All historical market observations, charts and data retain their original reference dates unless expressly stated otherwise.
VMF Research produces investment research and recommendations under the applicable provisions of Regulation (EU) No 596/2014 on market abuse and Commission Delegated Regulation (EU) 2016/958, subject to supervision by Portugal’s Comissão do Mercado de Valores Mobiliários (CMVM). The original publication includes investment recommendations and strategic asset-allocation conclusions. This article is not personalised investment advice and has not been prepared with reference to any reader’s objectives, financial circumstances, knowledge, experience, liquidity requirements or tolerance for risk. It does not constitute portfolio management, order execution, an offer to sell or a solicitation to purchase any financial instrument.
The analysis examines the interaction between government bond yields, corporate earnings, equity-market concentration, market breadth, investor sentiment, professional positioning and historical US presidential-election-cycle patterns. The interpretations presented reflect the author’s assessment of the evidence available at the original research cut-off. Market breadth indicators identify the extent of participation in a market advance or decline but do not reliably predict the timing, duration or magnitude of subsequent price movements. Similarly, investor sentiment indicators and hedge-fund positioning data provide incomplete measures of market expectations and should not be interpreted as comprehensive evidence of future buying or selling activity.
Historical seasonal patterns, including those associated with US midterm elections, describe average market behaviour across past periods. They do not establish that similar outcomes will occur in the current cycle. Corporate earnings estimates, forward valuations and assessments of the sustainability of market leadership depend on assumptions that may prove incorrect. Market concentration can persist for extended periods, while changes in interest rates, economic activity, investor positioning or earnings expectations can produce abrupt changes in market performance.
The subsequent rotation and risk-off developments described in the introduction do not establish that the original analysis correctly anticipated their timing or that the broader investment outlook has been validated. Views expressed on 9 October should not be interpreted as new or reaffirmed recommendations at the date of republication. The full October issue includes additional analysis, portfolio implications, implementation decisions and associated risks that are not reproduced in this standalone excerpt.
Disclosure of Interests: Neither VMF Research nor the author personally held financial instruments included in the VMF’s Strategic Asset Allocation Model Portfolio at the original research cut-off. As disclosed in the October issue, legal entities controlled by the author held a long position in the ARK Innovation ETF (ARKK), which is discussed in this excerpt. This interest may create an actual, potential or perceived conflict and should be considered when evaluating the analysis. Holdings may have changed since the stated disclosure date.
Neither VMF Research nor the author received compensation from any issuer, fund sponsor or other covered entity in connection with the preparation of the original research. No covered entity reviewed, approved or amended the investment conclusions before first dissemination.
The Model Portfolio is an illustrative research portfolio, not an investable fund or managed account. It does not represent client assets or transactions executed by VMF Research. Portfolio allocations, changes and reported performance are hypothetical research constructs based on the published methodology and reference prices. Research conclusions are intended within a medium- to long-term framework and are subject to periodic review as market conditions evolve.
Information has been obtained from sources considered reliable, including market data providers, company disclosures, economic statistics and third-party research, but its completeness and accuracy cannot be guaranteed. Past performance, simulated performance, historical market relationships and forward-looking scenarios are not reliable indicators of future results. All investments involve risk, including market volatility, liquidity risk and the possible loss of some or all invested capital. Readers should undertake their own analysis and, where appropriate, seek advice from an authorised financial adviser before making investment decisions.